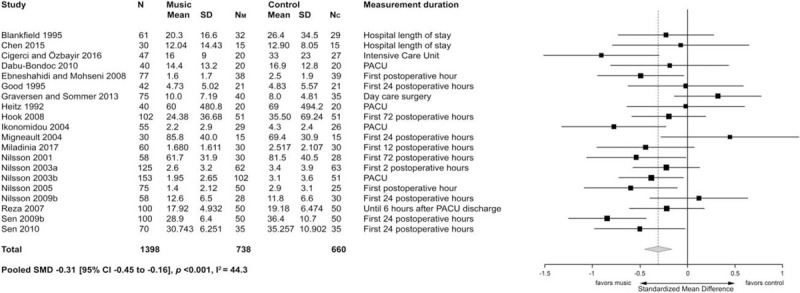
FIGURE 3.

Effect of perioperative music on postoperative opioid requirement. Forest plot presenting the effect of perioperative music on postoperative opioid requirement (milligrams of morphine equianalgesics). CI indicates confidence interval; Mean, mean milligrams of morphine equianalgesics; N, total number of patients in study; NC, number of patients in the control group; NM, number of patients in the music group; PACU, post-anesthesia care unit; SD, standard deviation in milligrams of morphine equianalgesics; SMD, standardized mean difference.
