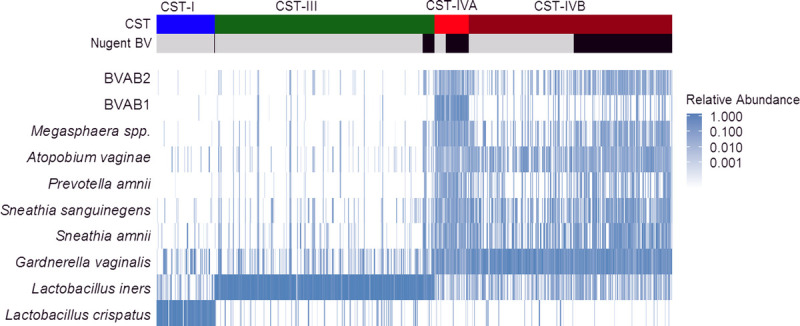
Figure 1.

Heatmap summarizing relative abundance for the 10 most abundant vaginal taxa by CST and Nugent BV status. The heatmap represents the relative abundance of the 10 taxa with highest mean relative abundance, shown for each observation, clustered by CST and Nugent BV status. Greater relative abundance is shaded with increasing intensity of blue color. Observations with Nugent BV (Nugent score 7–10) are indicated with black coloring.
