
Figure 3.
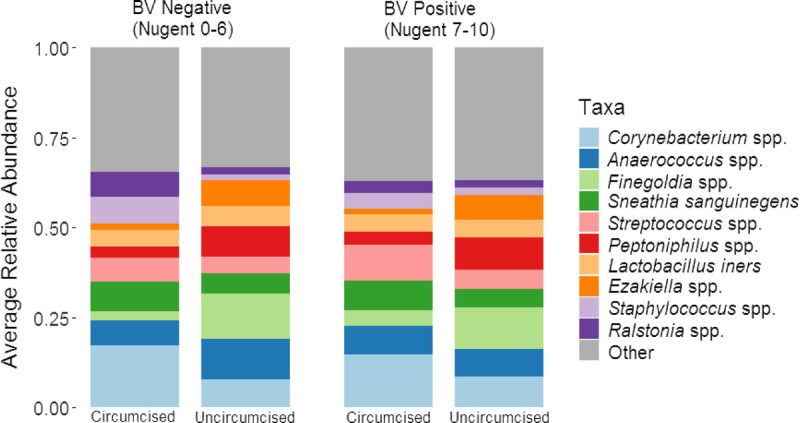
Stacked bar charts summarizing the mean relative abundance of 10 meatal taxa with the highest relative abundance by circumcision status and female partner BV status. These stacked bar charts summarize the mean relative abundance (y axis) of 10 penile taxa with the highest mean relative abundance, stratified by Nugent BV status and man’s circumcision status.