Figure 1.
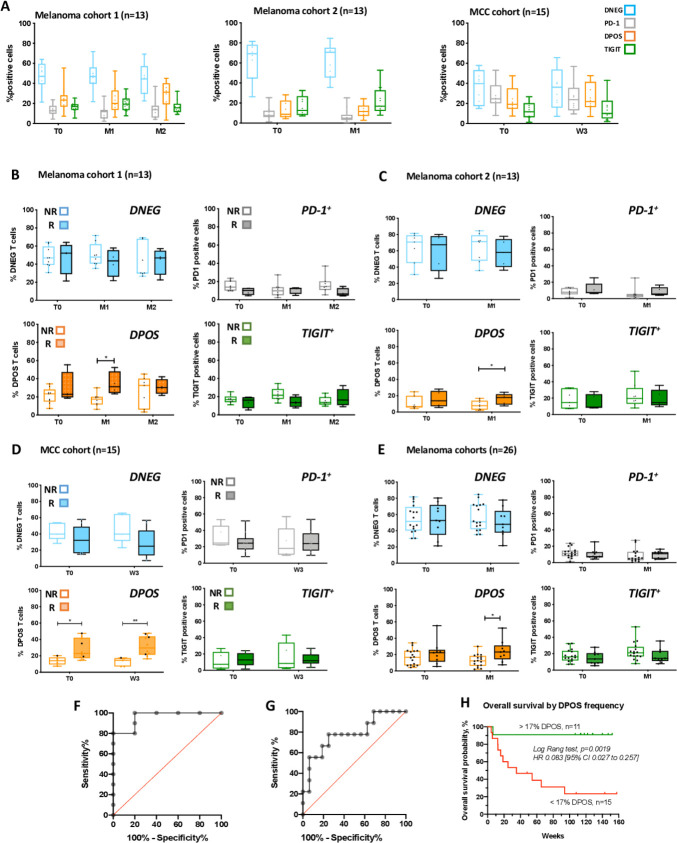
Frequency of PD-1+TIGIT+ (DPOS) peripheral T cells predicted therapeutic response to anti-PD-1. (A) Distribution of the four gated T-cell populations in the total CD8 population from the blood of melanoma patients (cohort 1 and 2, left and middle and MCC patients (left)) at baseline (T0), month 1 (M1) and month 2 (M2) for the first cohort, following anti-PD-1 therapy. Lines in box-and-whisker-plots indicate median values, boxes indicate IQR values and whiskers minimum and maximum values. (B) Percentages of DNEG, PD1 and TIGIT subpopulations according to clinical response to PD-1 therapy from the blood of melanoma patients (cohort 1) at baseline, and across time points following anti-PD-1 therapy (n=13). *P<0.05 using multiple comparison test corrected using the Holm-Sidak method. (C) Percentages of DNEG, PD1 and TIGIT subpopulations according to clinical response to PD-1 therapy from the blood of melanoma patients (cohort 2) at baseline, and across time points following anti-PD-1 therapy (n=14). *P<0.05 using multiple comparison test corrected using the Holm-Sidak method. (D) Percentages of DNEG, PD1 and TIGIT subpopulations according to clinical response to PD-1 therapy from the blood of MCC patients (n=15) at baseline, and across time points following anti-PD-1 therapy. *P<0.05, **P<0.01 using multiple comparison test corrected using the Holm-Sidak method. (E) Percentages of DNEG, PD1, DPOS and TIGIT subpopulations according to clinical response to PD-1 therapy in patients from the two melanoma cohorts. Lines in box-and-whisker-plots indicate median values, boxes indicate IQR values and whiskers minimum and maximum values.). *P<0.05 using multiple comparison test corrected using the Holm-Sidak method. (F, G) Receiver operator characteristic curves (ROC) defining the sensitivity and specificity of DPOS frequency in patients responding or not to anti-PD-1 therapy. (F) MCC patients (five non-responding and 10 responding). Area under the curve=0.96, p=0.0048. The cut-off value of 16.25% gives the highest accuracy, with 100% of sensitivity and 80% of specificity. (G) Melanoma patients from cohorts 1 and 2 (16 non-responding and 10 responding). Area under the curve=0.78, p=0.0203. The cut-off value of 17.35% gives the highest accuracy, with 77.8% of sensitivity and 75% of specificity. (H) Overall survival (weeks) of melanoma patients from the two cohorts grouped according to the estimated cut-off value of circulating DPOS frequency (<17%, red curve (n=15); >17% green curve (n=11)). Statistical comparison of survival curves was performed using log-rank (Mantel-Cox) test (p=0.0019). MCC, Merkel cell carcinoma; PD-1, programmed cell death 1 receptor.

