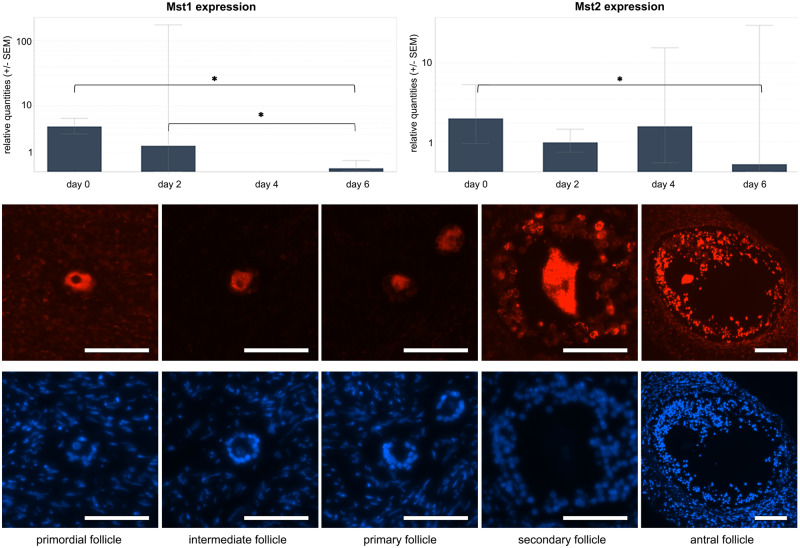
Figure 4.
Mst analysis. Upper panels: Mst1 expression over different culture days with significant downregulated subgroup ratios between culture Day 0 and Day 6 and between culture Day 2 and Day 6 in transgender follicles (left panel). Mst2 expression over different culture in transgender follicles with significant down-regulated subgroup ratios between culture Day 0 and day (right panel). *Statistically significant. Lower panels: Representative images of Mst1 expression (red dye) in primordial, intermediate, primary, secondary and antral follicle; underneath the same follicles stained with DAPI as a reference (in this example pictures: all transgender follicles on culture Day 6). Mst1 is present in the entire oocyte cytoplasm of the primordial and intermediate follicle, followed by clustering around the nucleus in the secondary follicle and resulting in a nuclear localisation in the antral oocytes. Scale bar = 50 µm.

