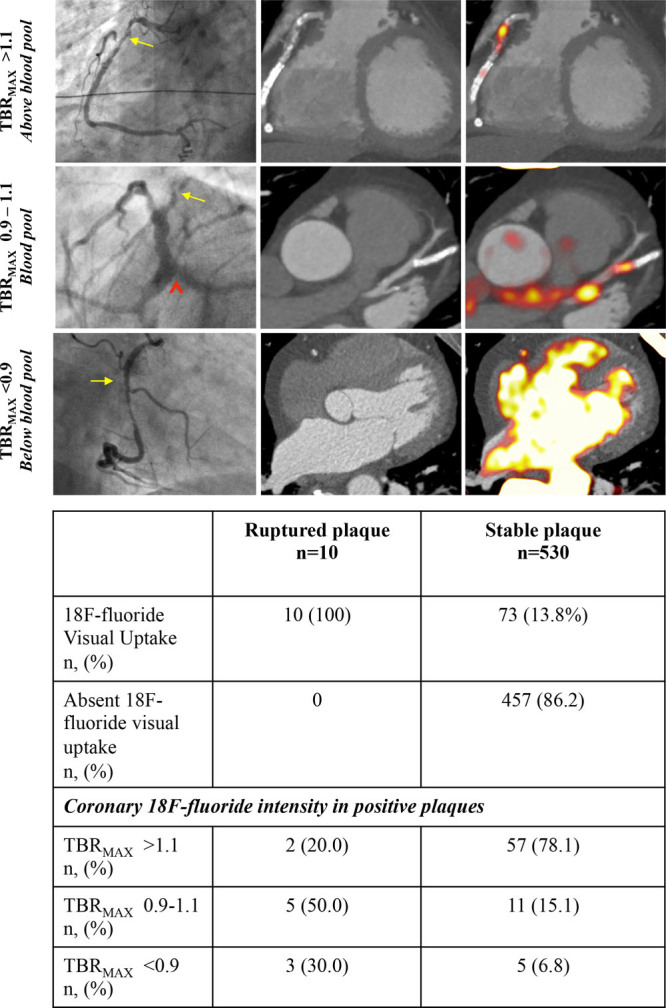
Figure 3.

Quantification of coronary 18F-fluoride activity. Visual identification of coronary 18F-fluoride activity was present in all ruptured plaques and 13.8% of stable coronary segments. The signal intensity of 18F-fluoride activity in coronary plaque was assessed both visually and semi-quantitatively by referencing to atrial blood pool activity (maximum target-to-background ratio [TBRMAX]). Activity in coronary plaques was categorized into activity above blood pool (TBRMAX >1.1), at or around blood pool (TBRMAX 0.9–1.1), or below blood pool (TBRMAX <0.9). Higher intensity signals were observed in stable segments compared with ruptured plaques.
