
Figure 3.
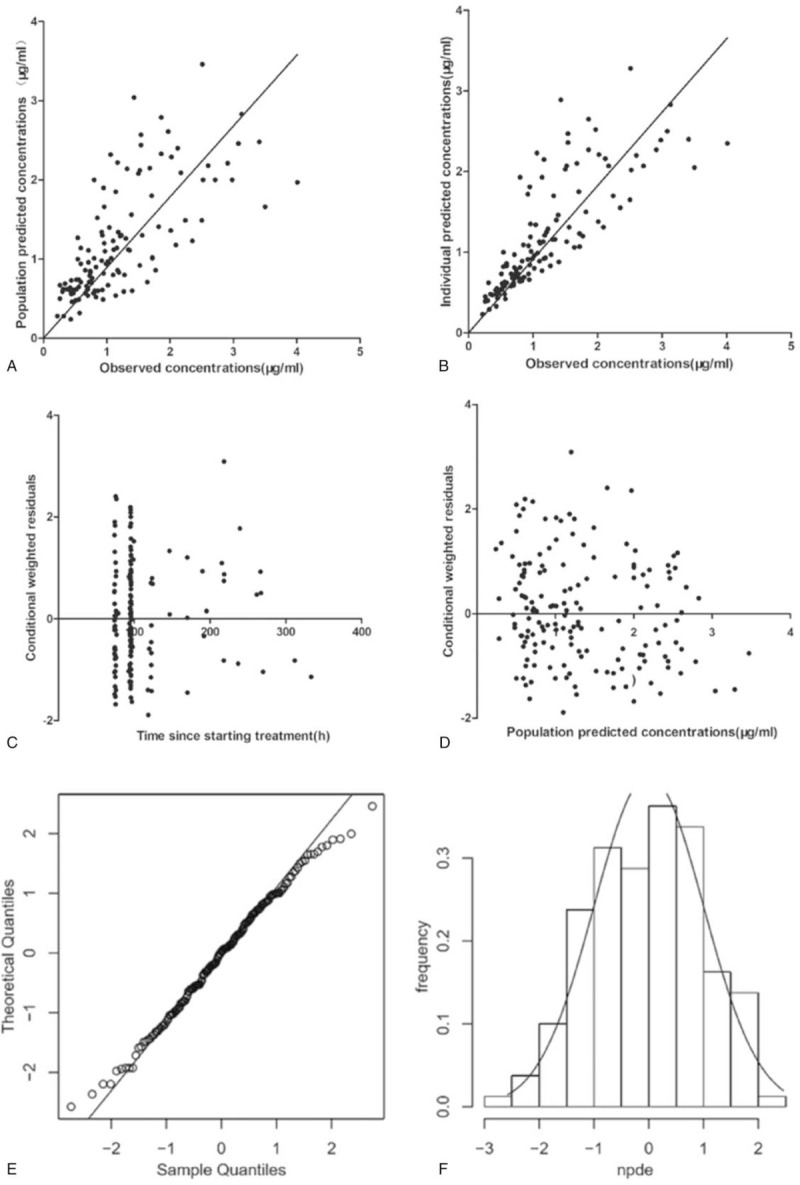
Model evaluation for metformin. (A) Population predicted concentrations versus observed concentrations; (B) individual predicted concentrations versus observed concentrations; (C) conditional weighted residuals versus time; (D) conditional weighted residuals versus population predicted concentrations; (E) QQ-plot of the distribution of the normalized prediction distribution errors versus the theoretical N (0, 1) distribution; (F) histogram of the distribution of the normalized prediction distribution errors, with the density of the standard Gaussian distribution overlaid.