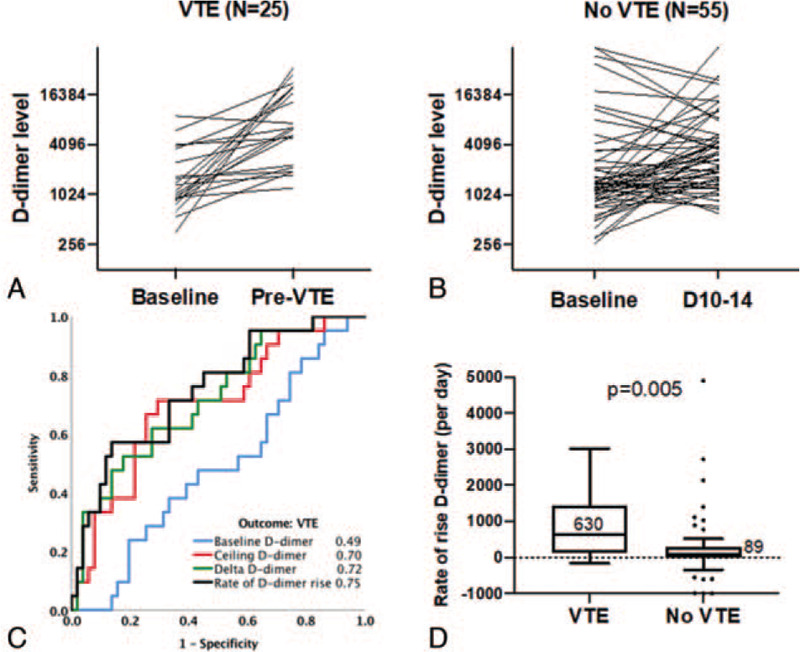
Figure 2.

Early changes in D-dimer predict VTE in hospitalized COVID-19 patients. (A) Individual patient-level trajectories of change in D-dimer in VTE patients, from baseline (average d-dimer between days 1–3) and ceiling levels (day before VTE diagnosis). (B) Individual patient-level trajectories of change in D-dimer in non-VTE patients, from baseline (average d-dimer between days 1–3) and ceiling levels (average D-dimer level between day 10–14). (C) ROC analysis with AUC values for baseline D-dimer, ceiling D-dimer, delta rise in D-dimer (ceiling minus baseline) and rate of change in D-dimer as predictors of VTE. AUC values are indicated. (D) Comparison of median rates of rise in D-dimer in VTE and non-VTE patients (Mann–Whitney U P-value is indicated). AUC = area under the curve, COVID-19 = coronavirus disease 2019, ROC = receiver operator characteristic curve, VTE = venous thromboembolism.
