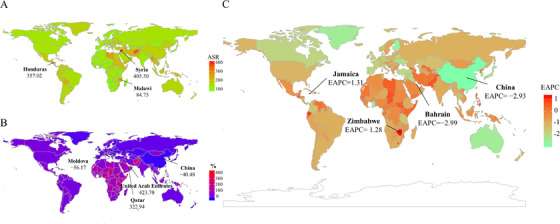
FIGURE 4.

The distribution and trends of DALYs due to leukemia in 195 countries/territories. A. The ASR of DALYs due to leukemia in195 countries/territories in 2017. B. The percentage changes in absolute numbers of leukemia DALYs between 1990 and 2017. C. The EAPCs in ASR of leukemia DALYs from 1990 to 2017. Countries/territories with an extreme value were annotated.
Abbreviations: ASR, age‐standardized rate; EAPC, estimated annual percentage change; DALY, disability‐adjusted life year
