
Figure 1.
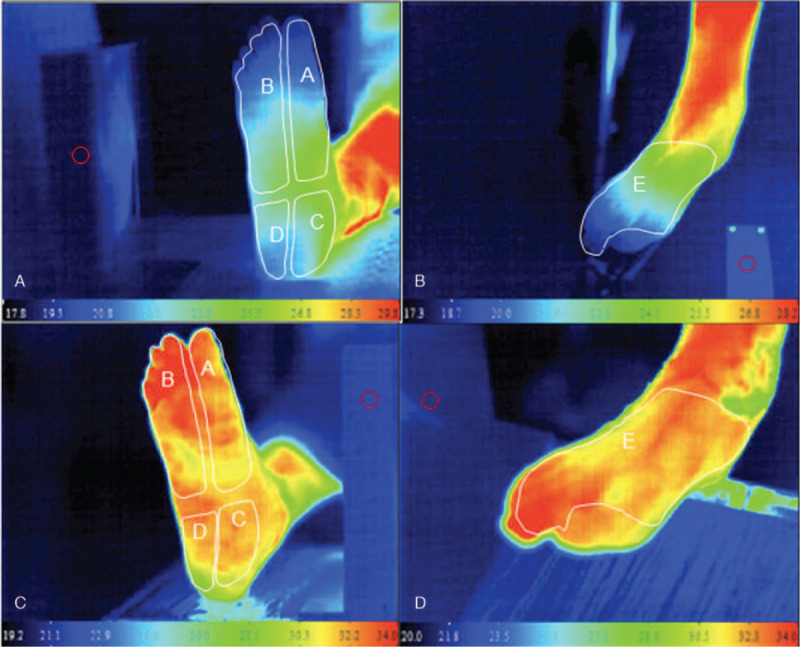
Typical thermal images of a patient's lower limb before and after successful EVT. Panel A: plantar aspect of right foot before EVT. The letters A-D depict angiosome-based thermographic zones used in this study. All zones, particularly in the digits, were hypothermic as compared with the normothermic zone in the lower leg. Panel B: Doral aspect of right foot. Letter E depicts zone of measurement in this study. It was also hypothermic, particularly in the digits. Panels C and D: Plantar and dorsal aspects of thermal images one day after successful EVT. All zones were normothermic.