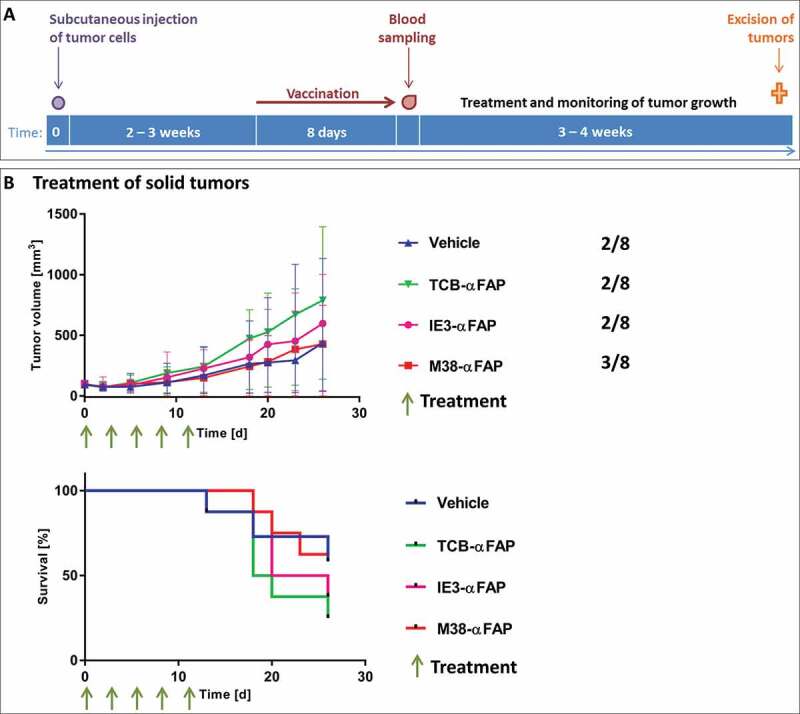
Figure 4.

Solid tumor model
(a) Schedule for the subcutaneous MC38 tumor model. The purple dot indicates the subcutaneous inoculation of 106 MC38-FAP colorectal cancer cells. Duration of the vaccination is depicted with a red arrow. One day after finalization of vaccination, blood was taken and the amount of M38-specific T cells was determined (red drop). Green stars show time points of treatments. The orange cross demonstrates euthanasia of mice and harvest of tumors. (b) Top: Growth kinetics of solid subcutaneous MC38 tumors after treatment with TCB-αFAP (green), M38-αFAP (red), IE3-MHCI-IgG (pink) or vehicle treatment (blue). Treatments started at an average tumor volume of 97 mm3 and were administered i.v. q3dx5 as shown by green arrows. Tumor-free mice per group are indicated on the right. All graphs show median per group (n = 8) with error bars indicating interquartile range. Bottom: Time-to-event analysis of solid subcutaneous MC38 tumors after treatment with TCB-αFAP (green), M38-αFAP (red), IE3-αFAP (pink), or vehicle treatment (blue). Treatments were administered i.v. q3dx5 as shown by green arrows. Group size was n = 8. A tumor volume > 500 mm3 was defined as event.
