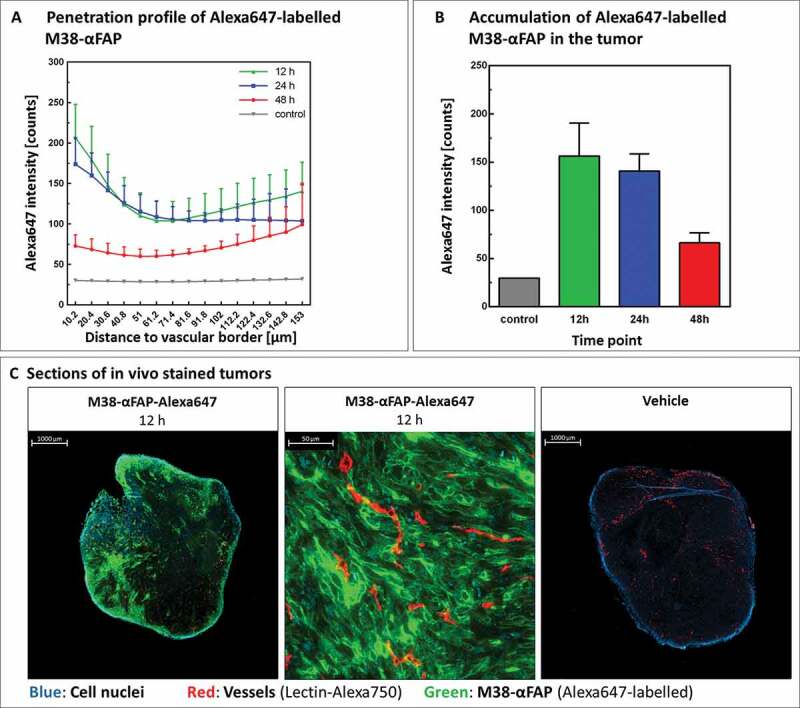
Figure 6.

Tumor penetration and accumulation of pMHCI-IgG molecules
(a) Penetration profile of Alexa647-labeled M38-αFAP molecule. Tumors were excised 12 hours (green), 24 hours (blue), and 48 hours (red) after intravenous injection of compound or vehicle (gray). Amount of M38-αFAP molecules in the tumor is depicted in relation to distance to vessel borders. All graphs show mean of different animals per group (n = 4) with error bars indicating standard deviation. (b) Accumulation of Alexa647-labeled M38-αFAP molecules in the tumor. Total amounts of M38-αFAP molecule present in the tumor 12 (green), 24 (blue), and 48 (red) hours after injection of molecule or vehicle (gray) are shown. All graphs show mean of different animals per group (n = 4) with error bars indicating standard deviation. (c) Sections of in vivo stained tumors excised 12 hours after injection of Alexa647-labeled M38-αFAP molecule (left) or vehicle (right). Close-up image of tumor tissue with high penetration of Alexa647-labeled M38-αFAP molecules shows binding of labeled molecule to tumor cells (middle). Color code: Cell nuclei (blue), vessels (red), M38-αFAP (green).
