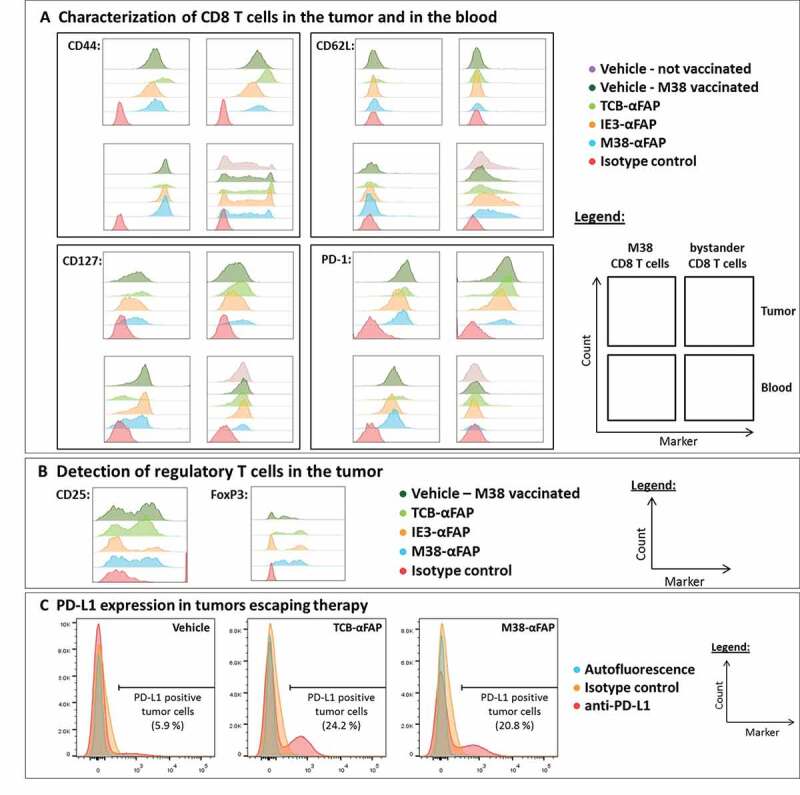
Figure 8.

Flow cytometry analysis of T cells and tumor cells from M38 vaccinated and pMHCI-IgG or TCB-treated mice
(a) CD44 (top left), CD62L (top right), CD127 (bottom left), and PD-1 (bottom right) expression of M38-specific (left column each marker) and nonspecific (right column each marker) CD8 T cells isolated from solid MC38-FAP tumors (top row each marker) and peripheral blood (bottom row each marker) 48 hours after the second treatment. Color code for treatment: Not vaccinated/vehicle (purple – markers only detectable for unspecific CD8 T cells in the blood, no T cells detectable inside the tumor mass), M38 vaccinated/vehicle (dark green), M38 vaccinated/TCB-αFAP (light green), M38 vaccinated/IE3-αFAP (orange), M38 vaccinated/M38-αFAP (blue), isotype control antibody (red). (b) Flow cytometry analysis for CD25 (left) and FoxP3 (right) of CD4 T cells in tumor samples 48 hours after the second treatment. Color code for treatment: M38 vaccinated/vehicle (dark green), M38 vaccinated/TCB-αFAP (light green), M38 vaccinated/IE3-αFAP (orange), M38 vaccinated/M38-αFAP (blue), isotype control antibody (red). (c) Flow cytometry analysis of tumors, which escaped pMHCI-IgG or TCB therapy. Tumors of the M38 vaccinated and vehicle-treated (left), M38 vaccinated and TCB-αFAP treated (middle), and M38 vaccinated and M38-αFAP treated (right) groups were analyzed for PD-L1 expression on the tumor cell surface. Color code: Autofluorescence of cells (blue), isotype control antibody (orange), anti-PD-L1 antibody (red).
