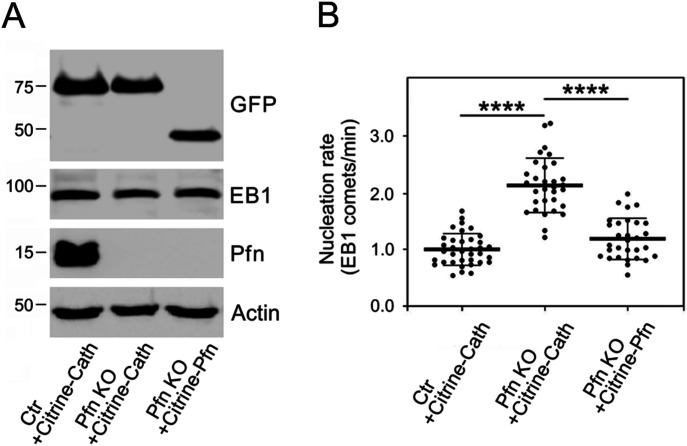
Figure 4. Phenotypic rescue of increased microtubule nucleation in KO27 cells.
(A) Immunoblot analysis of whole-cell lysates of B16 control cells expressing citrine-cathepsin B (Ctr+Citrine-Cath), profilin knock-out KO27 cells expressing citrine-cathepsin B (Pfn KO+Citrine-Cath), and KO27 cells rescued by citrine-profilin (Pfn KO+Citrine-Pfn). Blots were probed with Abs to GFP to detect citrine-tagged proteins, to EB1 to detect co-expressed EB1-tdTomato, profilin (Pfn), and to actin (loading control). (B) Comparison of the microtubule nucleation rate observed in KO27 (Pfn KO) cells expressing Citrine-cathepsin B and Citrine-profilin, respectively, and in control cells (Ctr) expressing Citrine-cathepsin B. Three independent experiments and at least 10 cells analyzed in each experiment, n = 36 (Ctr+Citrine-Cath), n = 31 (Pfn KO+Citrine-Cath), and n = 30 (Pfn KO+Citrine-profilin); abbreviations as in left panel. The thick and thin lines within dot box plots represent mean ± SD; ****P < 0.0001.

