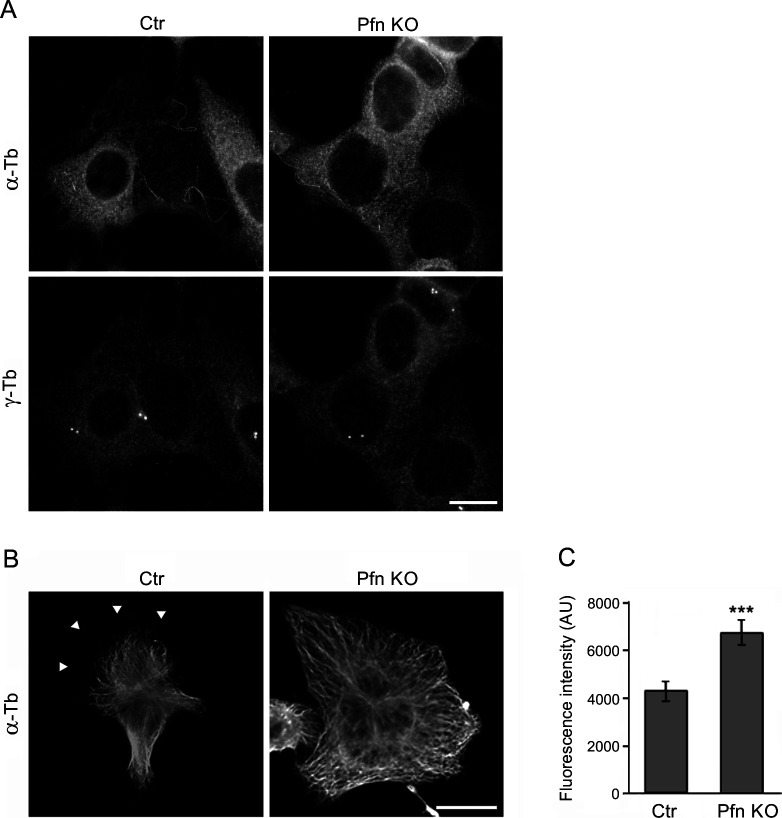
Figure S3. Nocodazole-resistant microtubules and microtubule organization in profilin knock-out cells (KO27).
(A) Nocodazole-resistant microtubules in B16 control (Ctr) and KO27 (Pfn KO) cells simultaneously stained by Abs to α-tubulin (α-Tb) and γ-tubulin (γ-Tb). Fixation F/Tx/M (see the Materials and Methods section). Scale bar, 10 μm. (B) Microtubule organization in B16 control (Ctr) and KO27 (Pfn KO) cells stained by Ab to α-tubulin (α-Tb). Arrowheads in left panel (Ctr) denote the tip of the cell edge. Scale bar, 10 μm. (C) Bar graph showing increased α-tubulin fluorescence in two randomly picked areas of standardized size (144 μm2) in the lamellae of control (n = 29) and KO27 (n = 33) cells, respectively. Mean ± SEM, ***P < 0.001.

