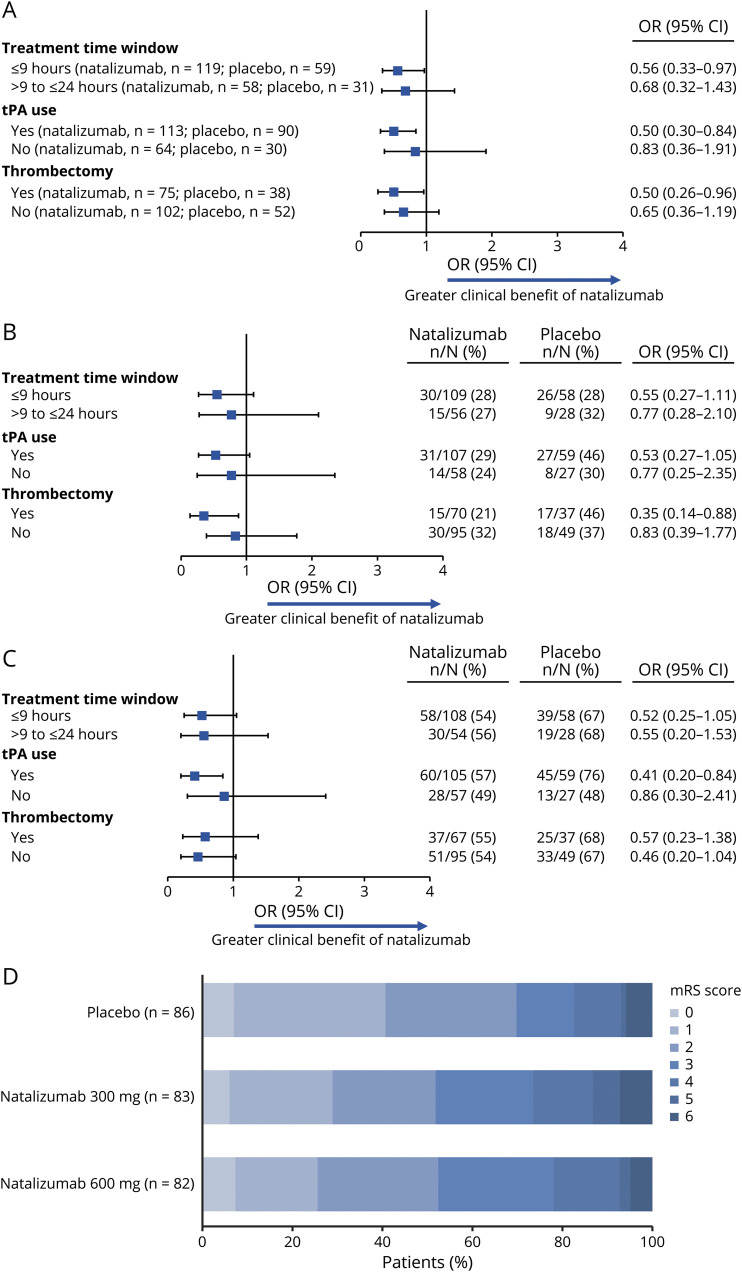
Figure 2. Subgroup analyses of the odds of an excellent outcome.
Subgroup analyses of the odds of an excellent outcome on (A) the composite endpoint, (B) the modified Rankin scale (mRS), and (C) the Barthel Index (BI) at day 90 in the modified intent-to-treat population treated with natalizumab 300 mg or 600 mg vs placebo and (D) distributions of mRS scores at day 90. CI = confidence interval; OR = odds ratio; tPA = tissue plasminogen activator.

