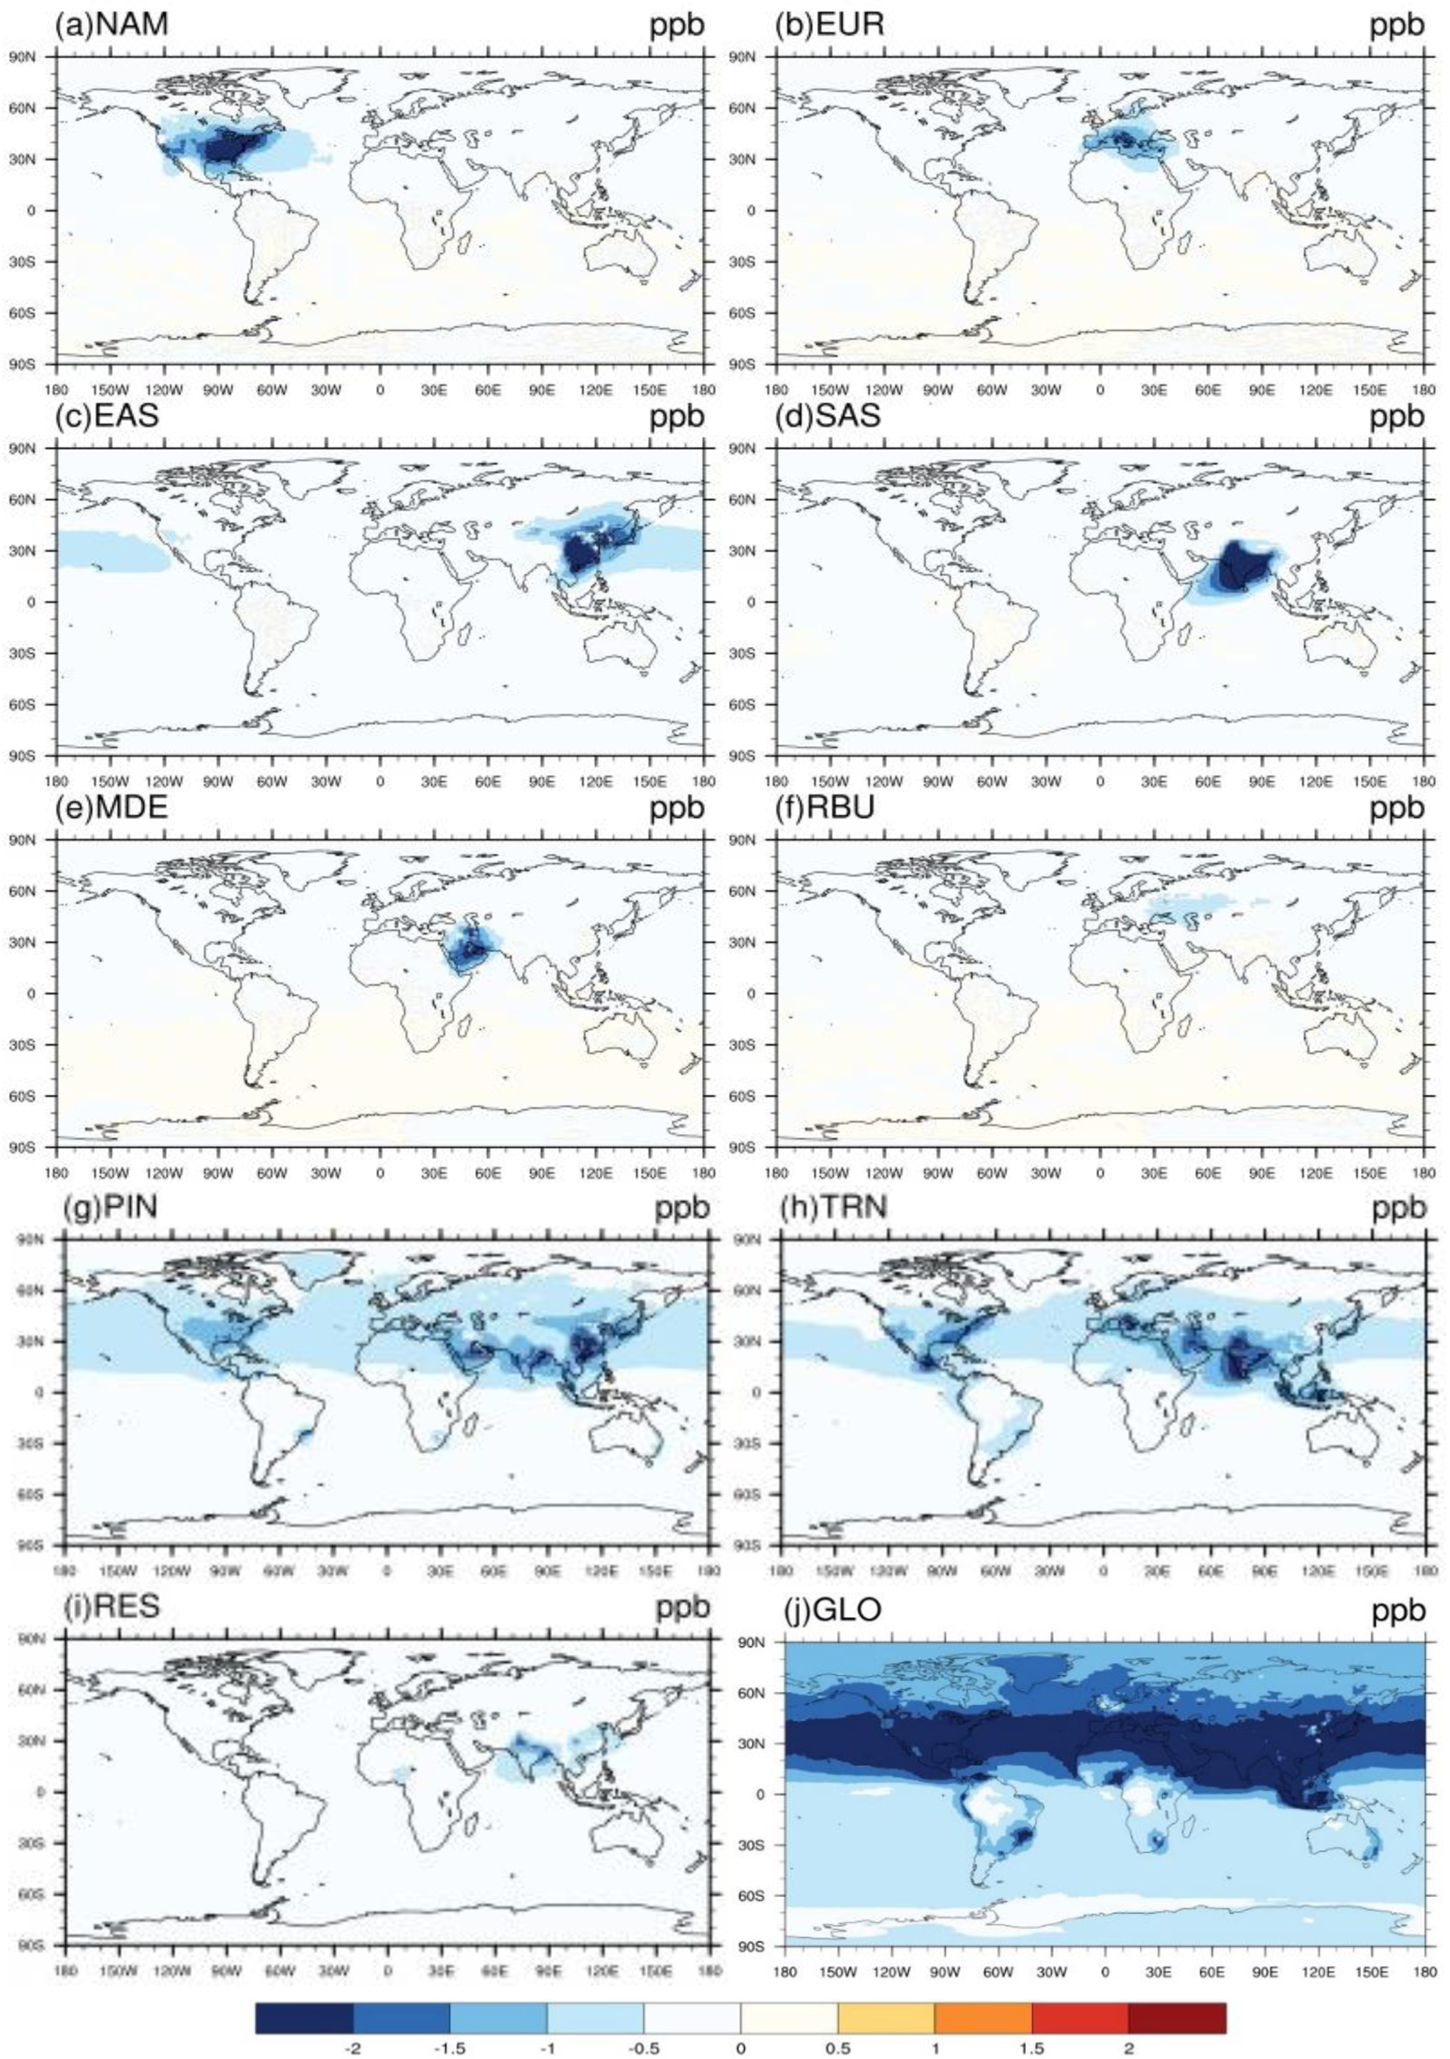
Figure 1–

Global difference in multi-model mean O3 concentrations (ppb) in 20% emission reduction scenarios relative to the baseline for the year 2010 in a) North America (NAM), b) Europe (EUR), c) East Asia (EAS), d) South Asia (SAS), e) Middle East (MDE), f) Russia/Belarus/Ukraine (RBU), g) Power and Industry (PIN), h) Transportation (TRN), i) Residential (RES) and j) Global (GLO), shown for the 6-mo. O3 season average of 1-hr. daily maximum health relevant metric.
