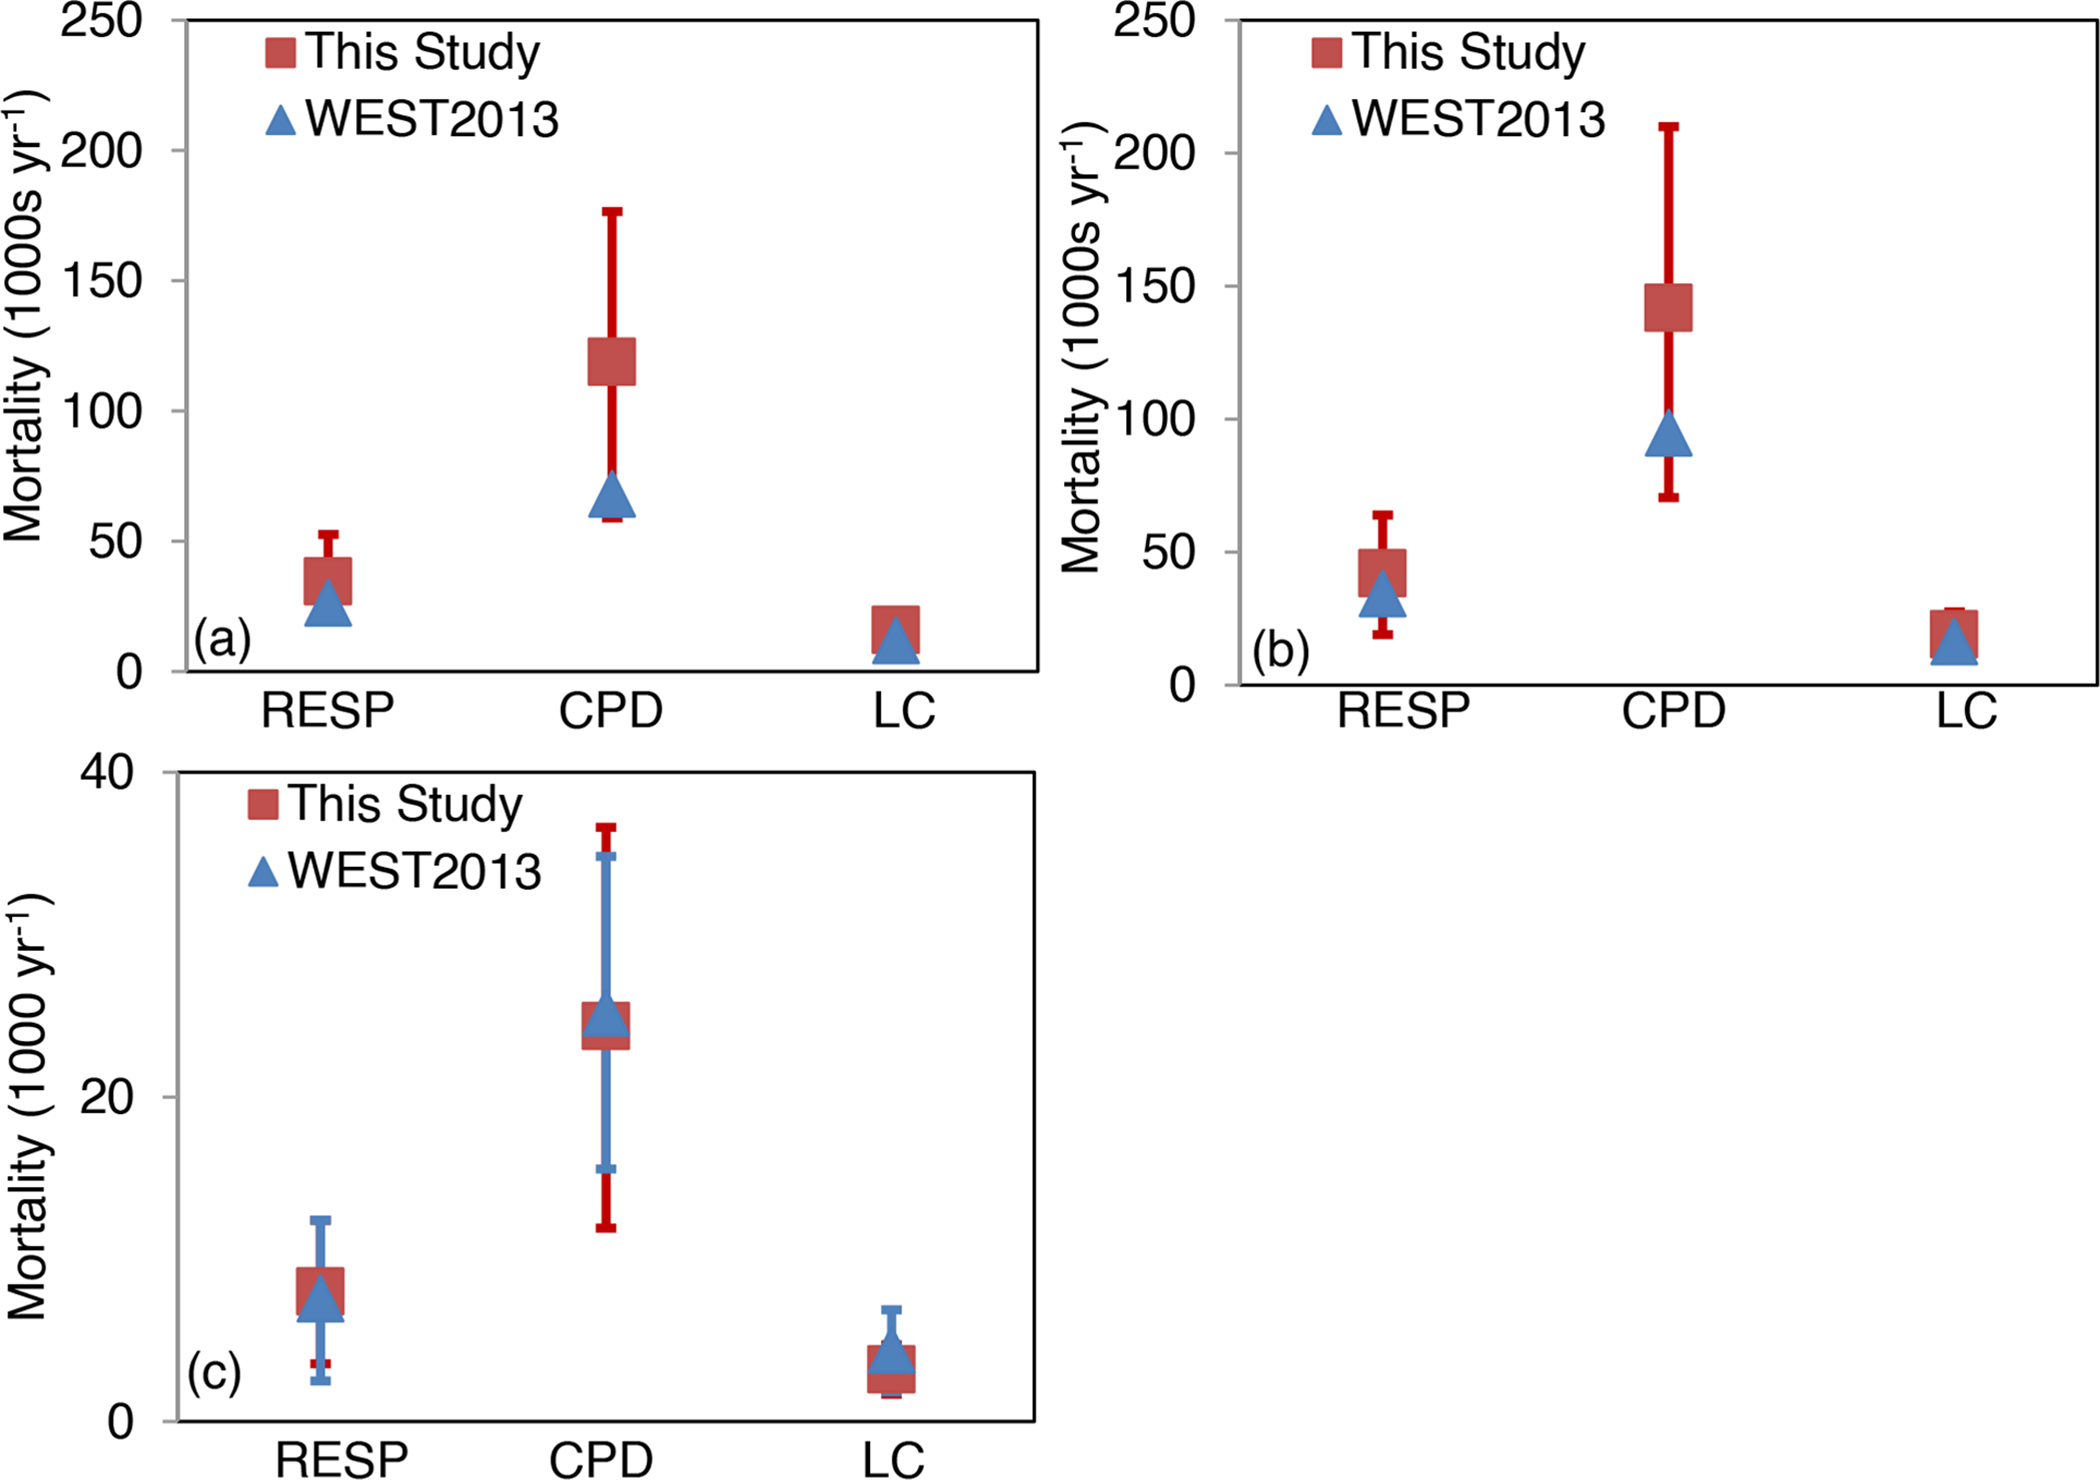
Figure 3.

Comparisons between this study (red) and WEST2013 (blue) of the avoided human mortality in the US (1000 deaths yr−1) from air quality changes in 2050 compared with 2000, for (a) REF scenario, (b) RCP4.5 scenario, and (c) the total co-benefits in 2050. The red lines represent the 90% confidence intervals (CI) for this study, and blue lines are 95% CI for WEST2013. RESP indicates mortality from O3-related respiratory deaths, CPD for PM2.5-related cardiopulmonary deaths, and LC for PM2.5-related lung cancer.
