
Figure 4.
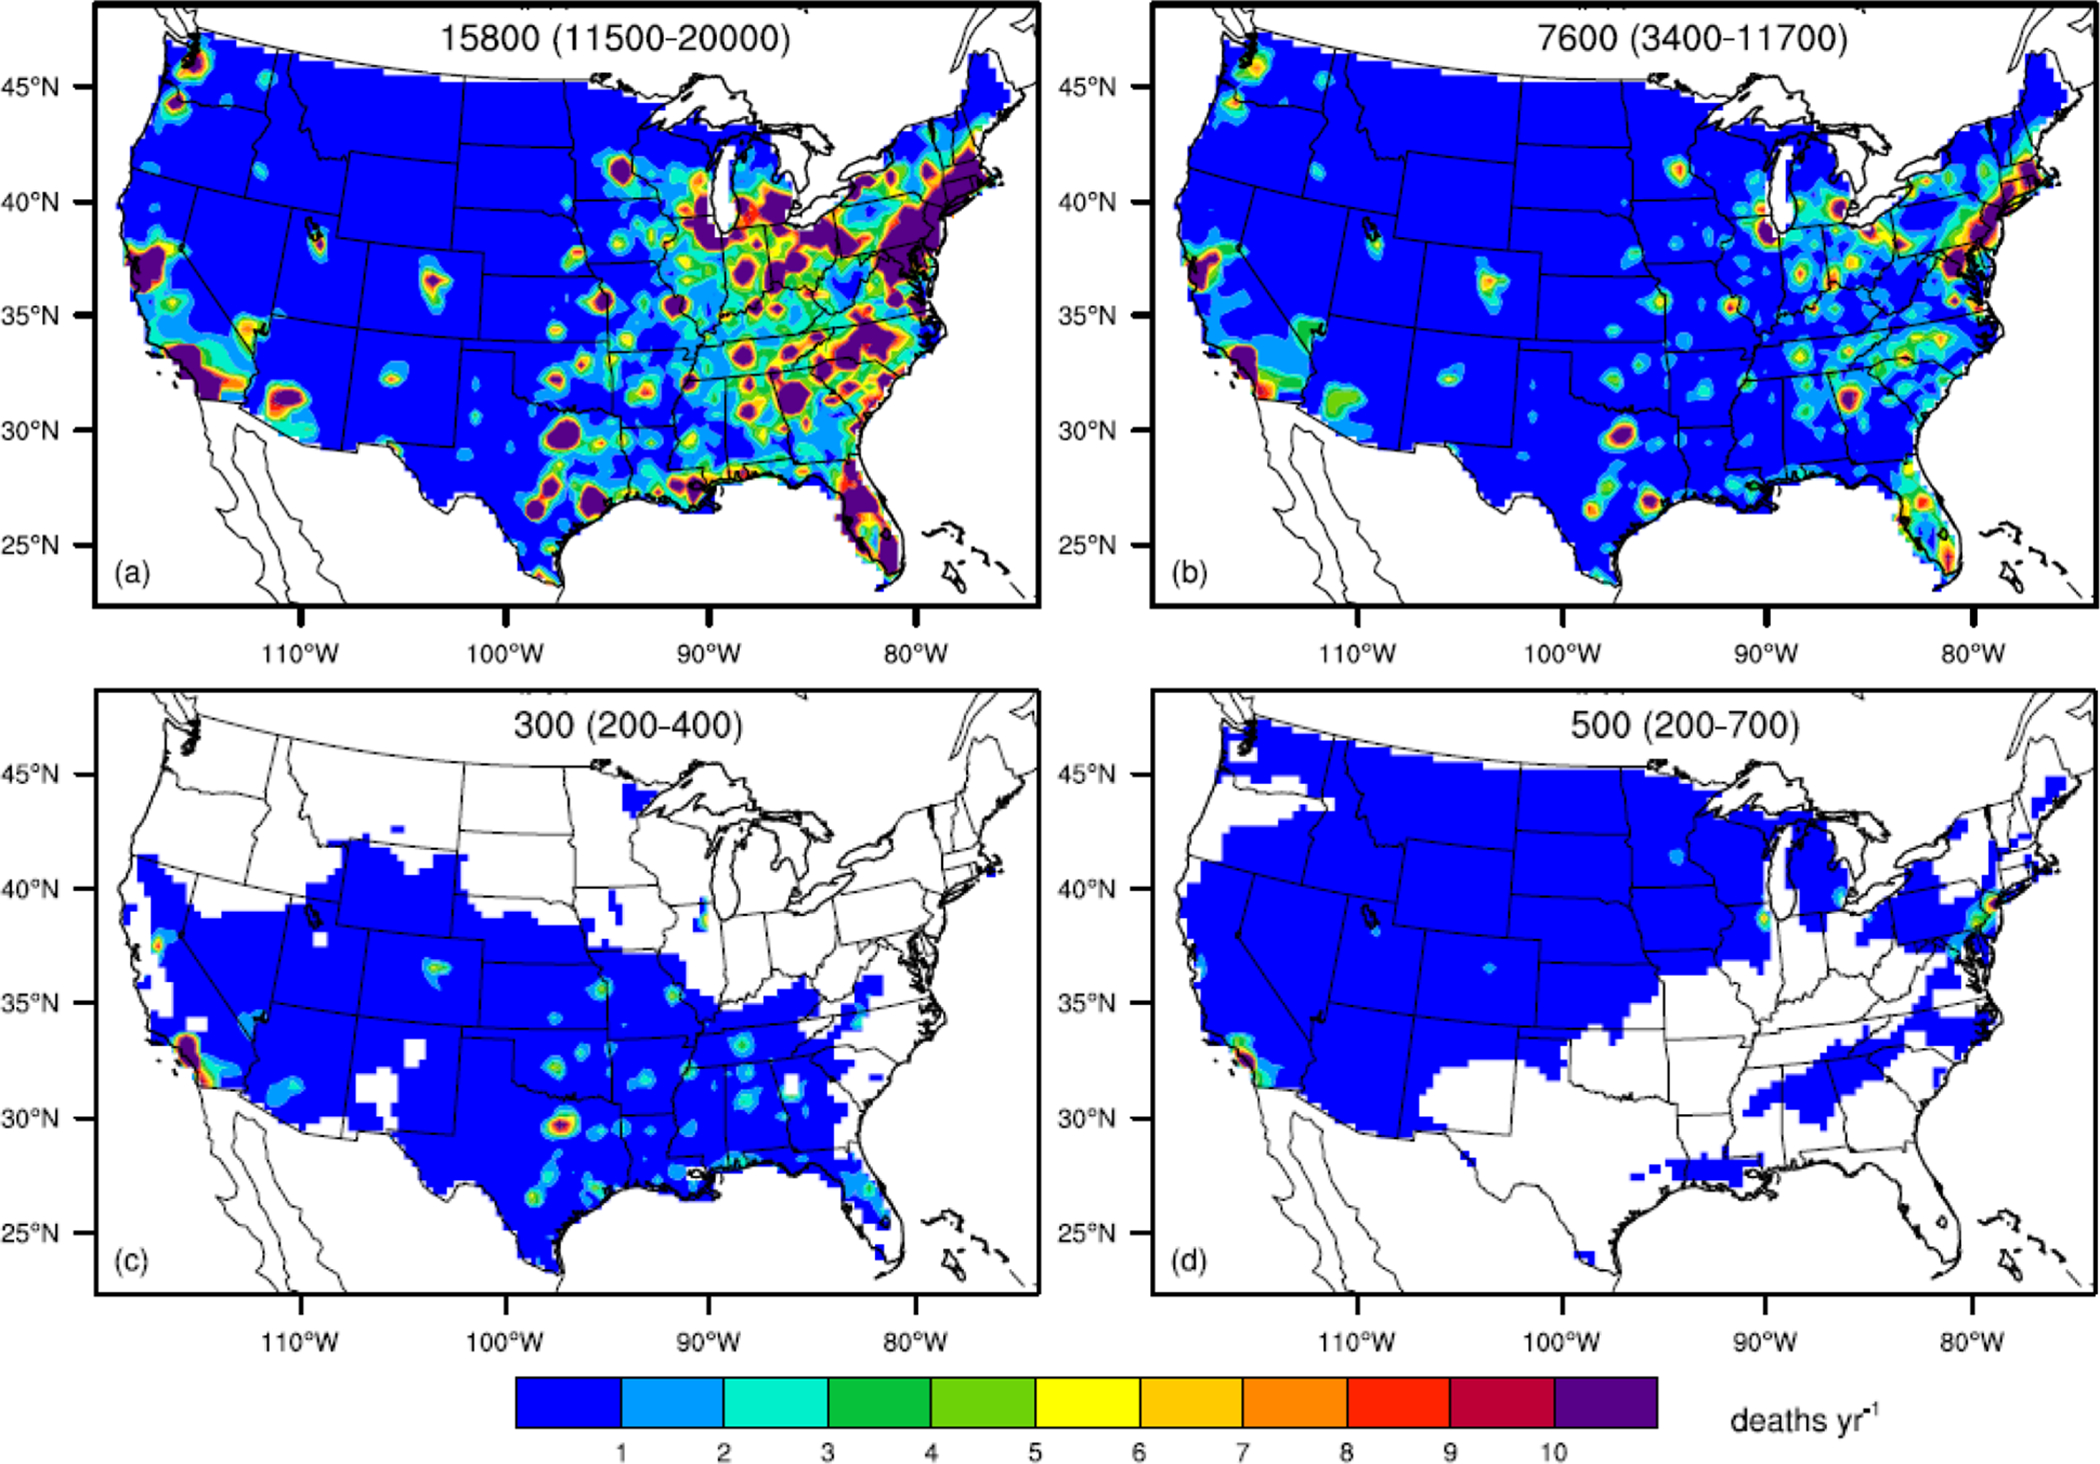
The emission co-benefits (a, b) and climate co-benefits (c, d) for avoided human mortality in 2050 (deaths yr−1) from PM2.5 (a, c) and O3 (b, d). White in panels c and d indicates increased mortality attributed to slowing climate change, from increases in air pollutant concentrations. Total avoided deaths and 90% confidence intervals are shown at the top of each panel. Positive values indicate fewer deaths.