
Figure 5.
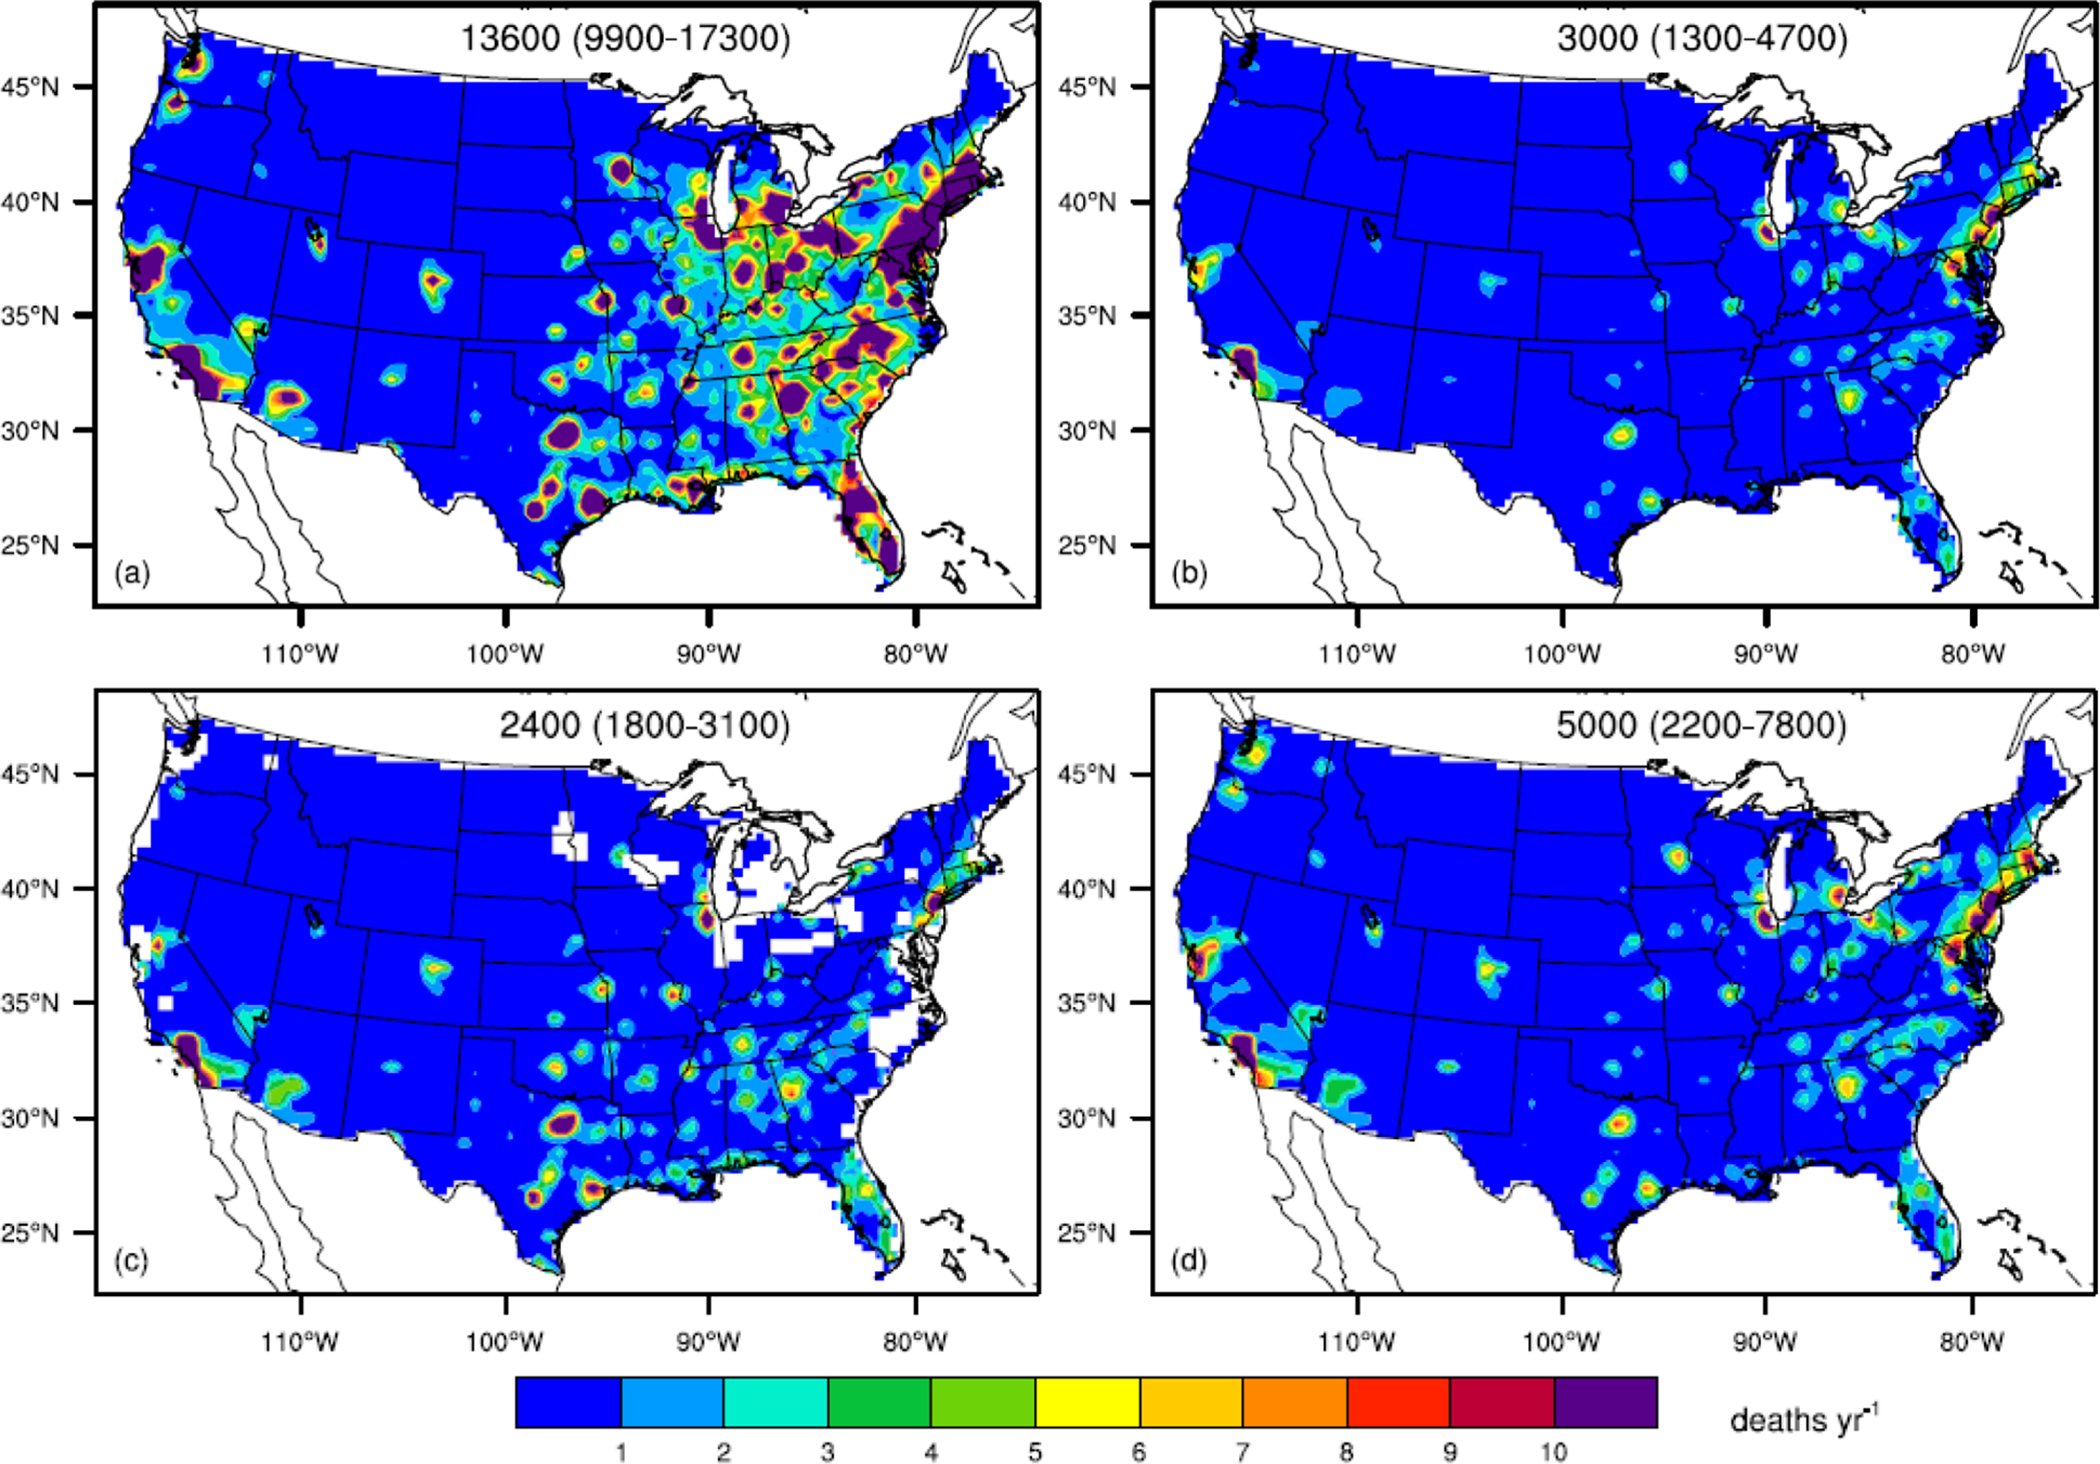
Domestic (a, b) and foreign co-benefits (c, d) for avoided all-cause mortality from PM2.5 (a, c) and respiratory disease from O3 (b, d) in the US in 2050. Total avoided deaths and 90% confidence intervals are shown at the top of each panel. Positive values indicate fewer deaths.