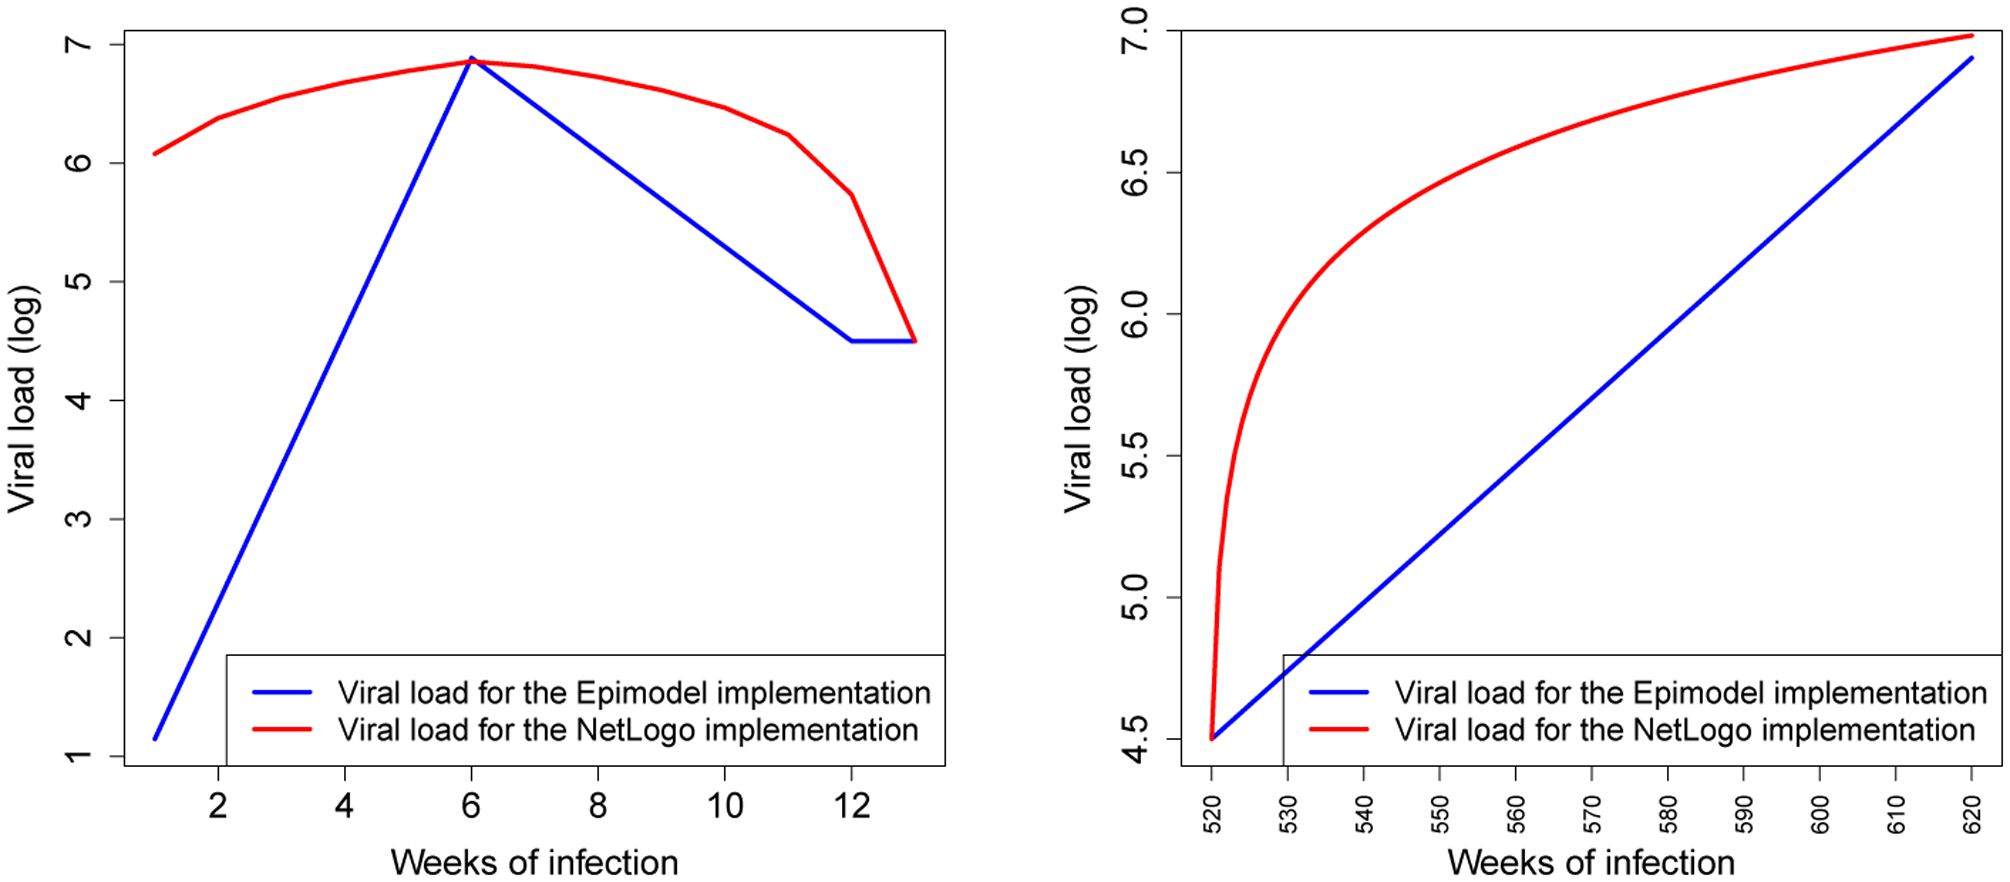
Figure 1:

The viral load progression, the logarithm (base 10) of the number of copies of virus in one’s blood, over time during the onset stage (left) and the AIDS stage (right) across the two implementations; EpiModel (Blue) and the NHS model (Red).
