Figure 5:

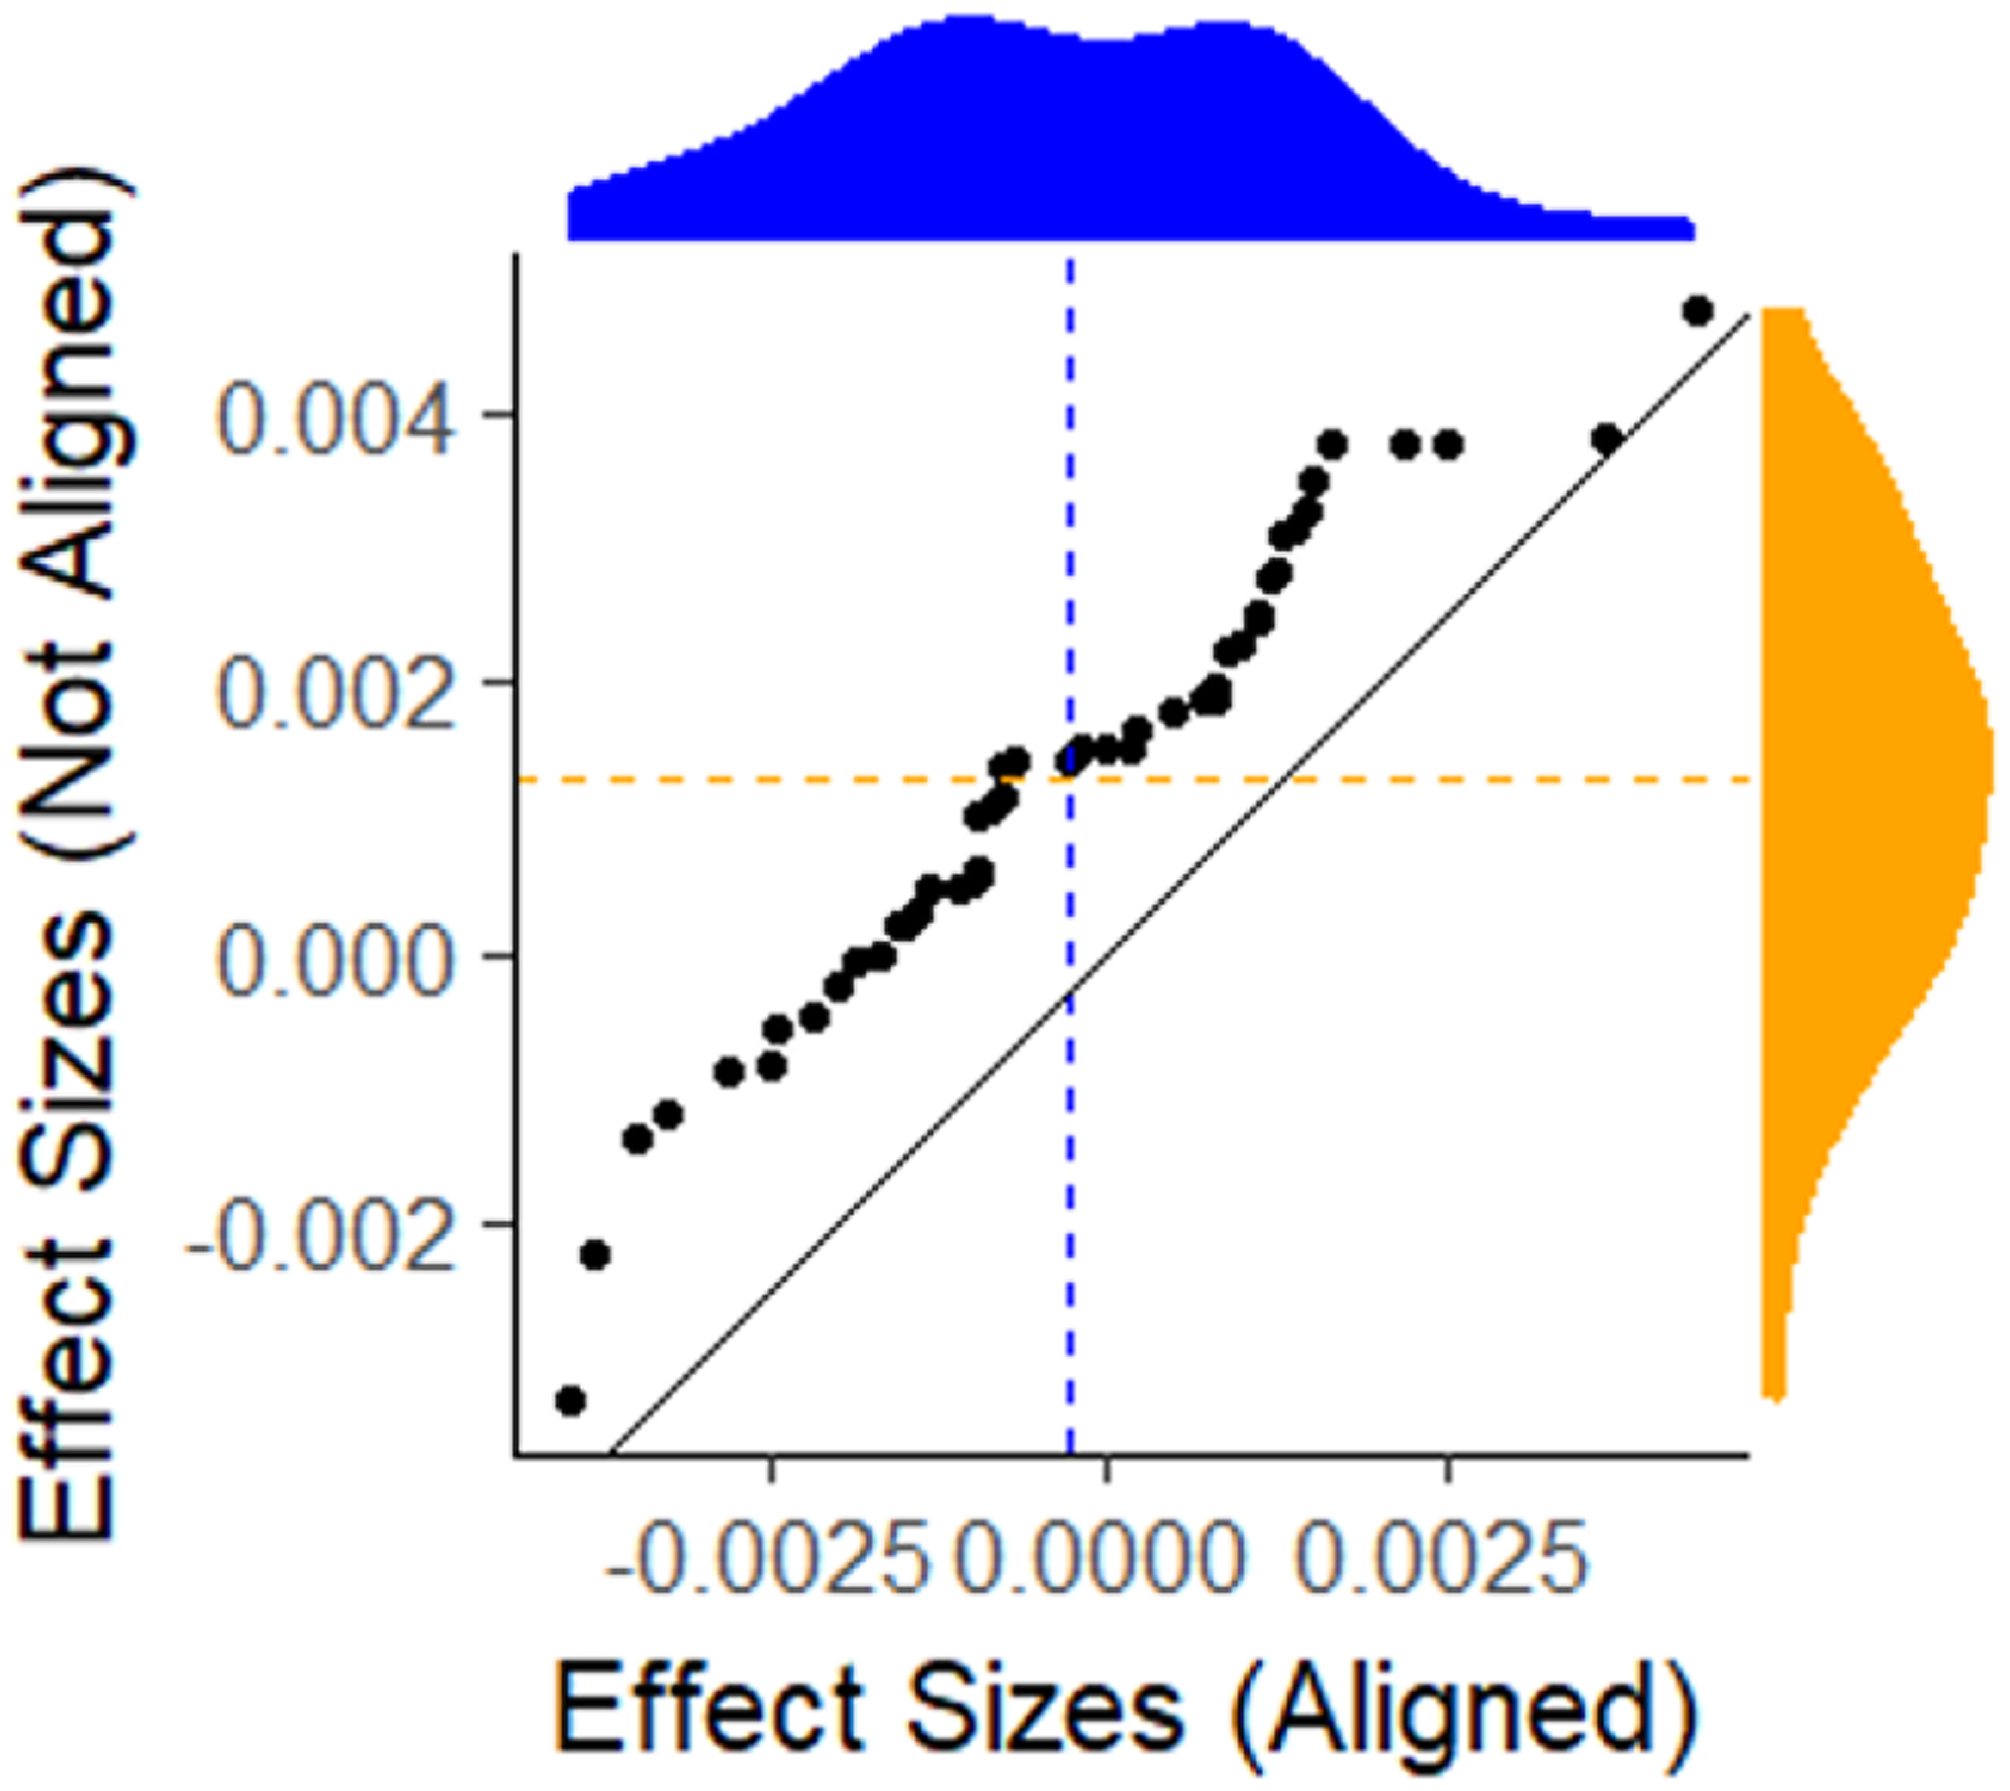
An empirical Q-Q plot of the effect sizes for the aligned versus the non-aligned comparison of the incidence distributions. Whereas the aligned effect sizes are centered (blue) around 0, the non-aligned effect sizes (yellow) are not.

An empirical Q-Q plot of the effect sizes for the aligned versus the non-aligned comparison of the incidence distributions. Whereas the aligned effect sizes are centered (blue) around 0, the non-aligned effect sizes (yellow) are not.