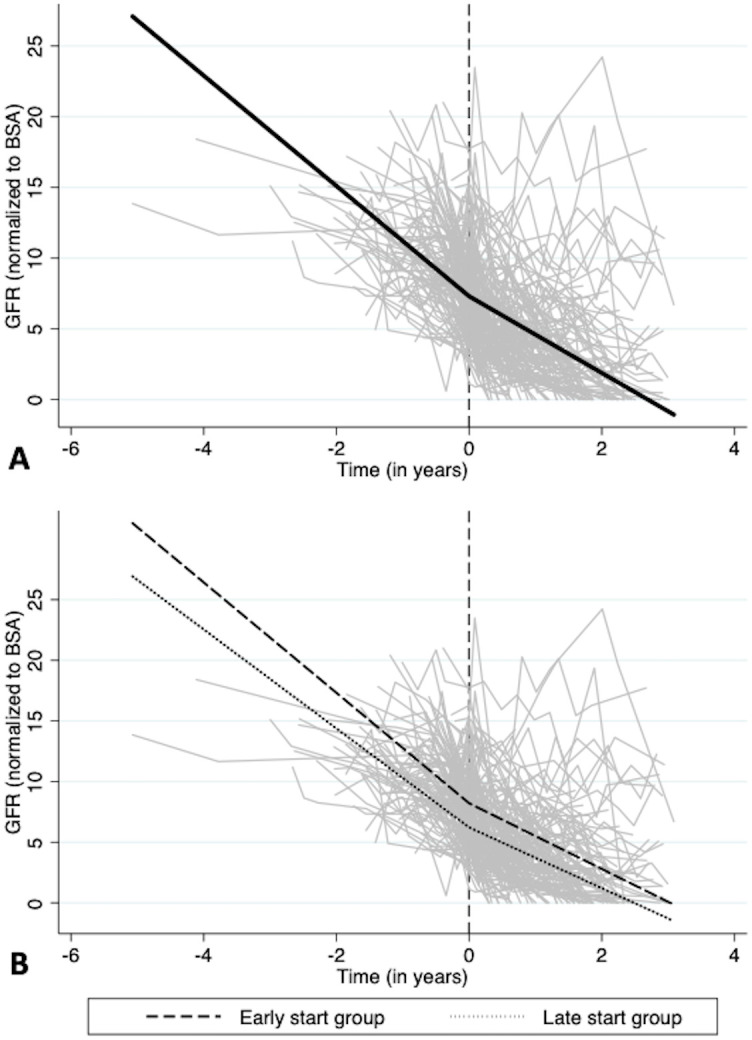
Fig 2. Trend of glomerular filtration rate (normalized to BSA) over time [A] in all patients and [B] for each treatment group.

The gray lines represent individual patient measurements and the black lines represent the predicted slopes in the pre- and post-dialysis initiation periods.
