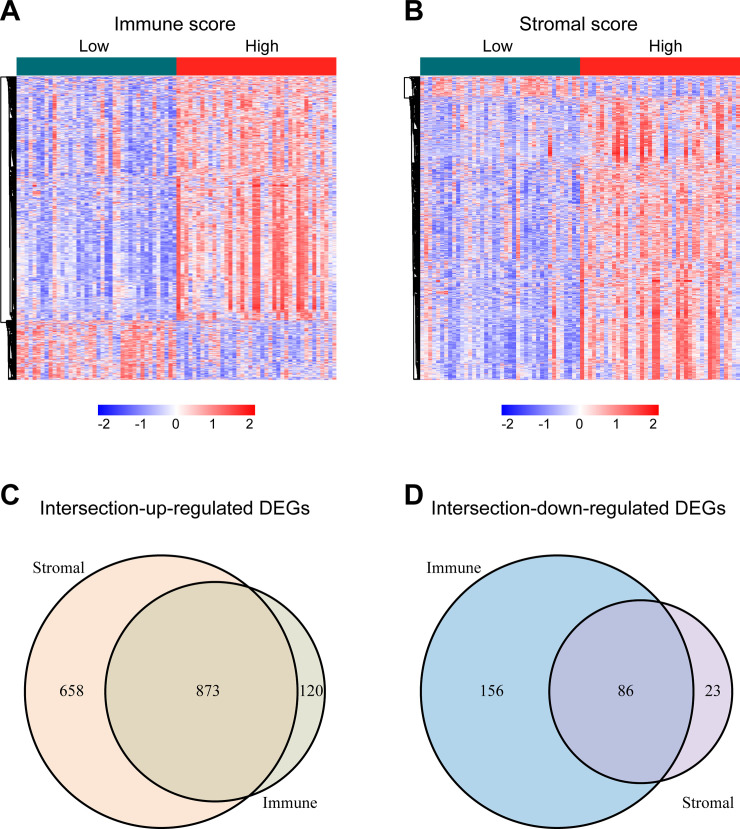
Fig 2. Identification of the intersection DEGs among immune and stromal scores in UM.
(A) Heatmap of the DEGs of immune scores of top half (high score) vs. bottom half (low score). (Cutoff: |log2(fold-change) |> 1, FDR < 0.05). (B) Heatmap of the DEGs of stromal scores of top half (high score) vs. bottom half (low score). (Cutoff: |log2(fold-change) |> 1, FDR < 0.05). (C, D) Venn diagrams showing the number of intersection-up-regulated DEGs (C) or intersection-down-regulated DEGs (D) in stromal and immune score groups. Heatmaps were drawn based on the average method and correlation distance measurement method. Genes with higher expression are shown in red, lower expression are shown in blue, genes with same expression level are in white. DEGs: differentially expressed genes; UM: uveal melanoma; FDR: false discovery rate.

