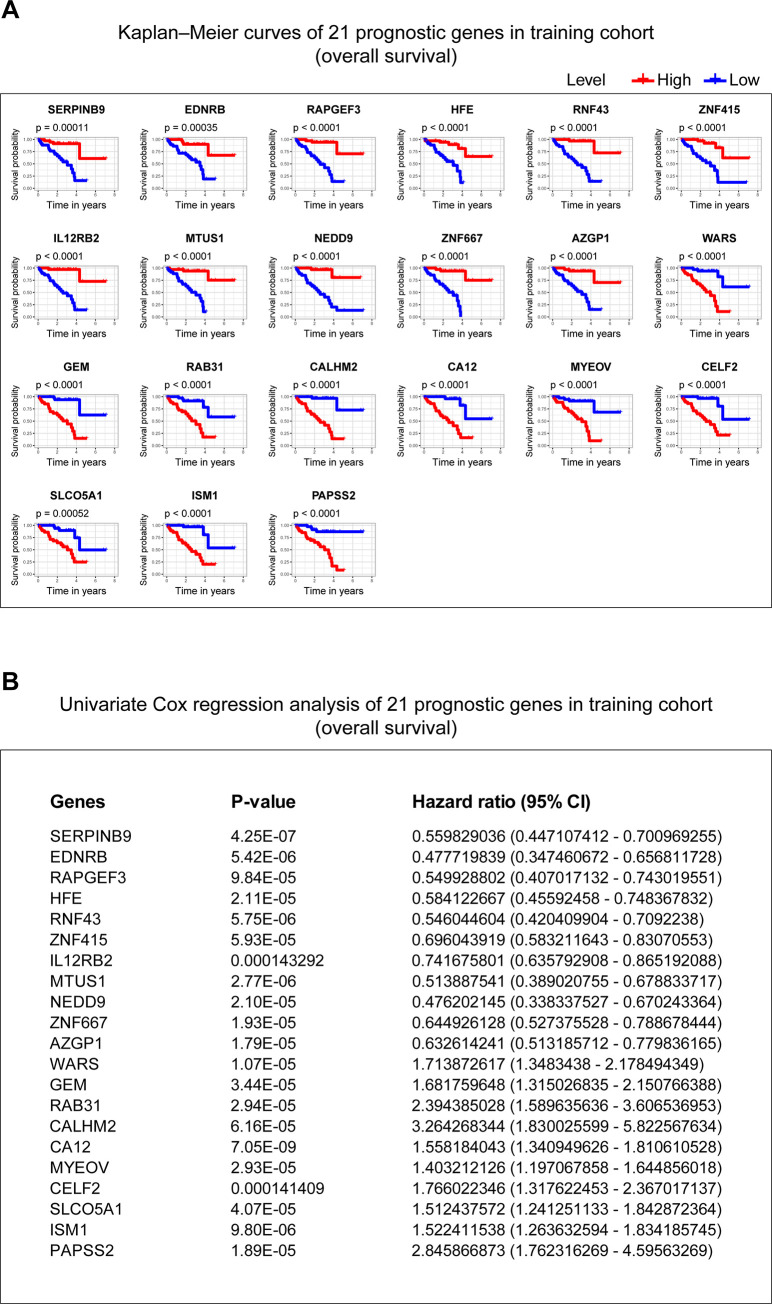
Fig 4. Kaplan–Meier curves and univariate Cox analysis of 21 genes in the training cohort.
(A) The Kaplan–Meier curves of 21 genes in the training cohort. P-value was examined in the Log rank test. (B) The univariate Cox analysis of 21 genes in the training cohort. P-value < 0.01 is considered statistically significant. 95% CI: 95% Confidence Interval.

