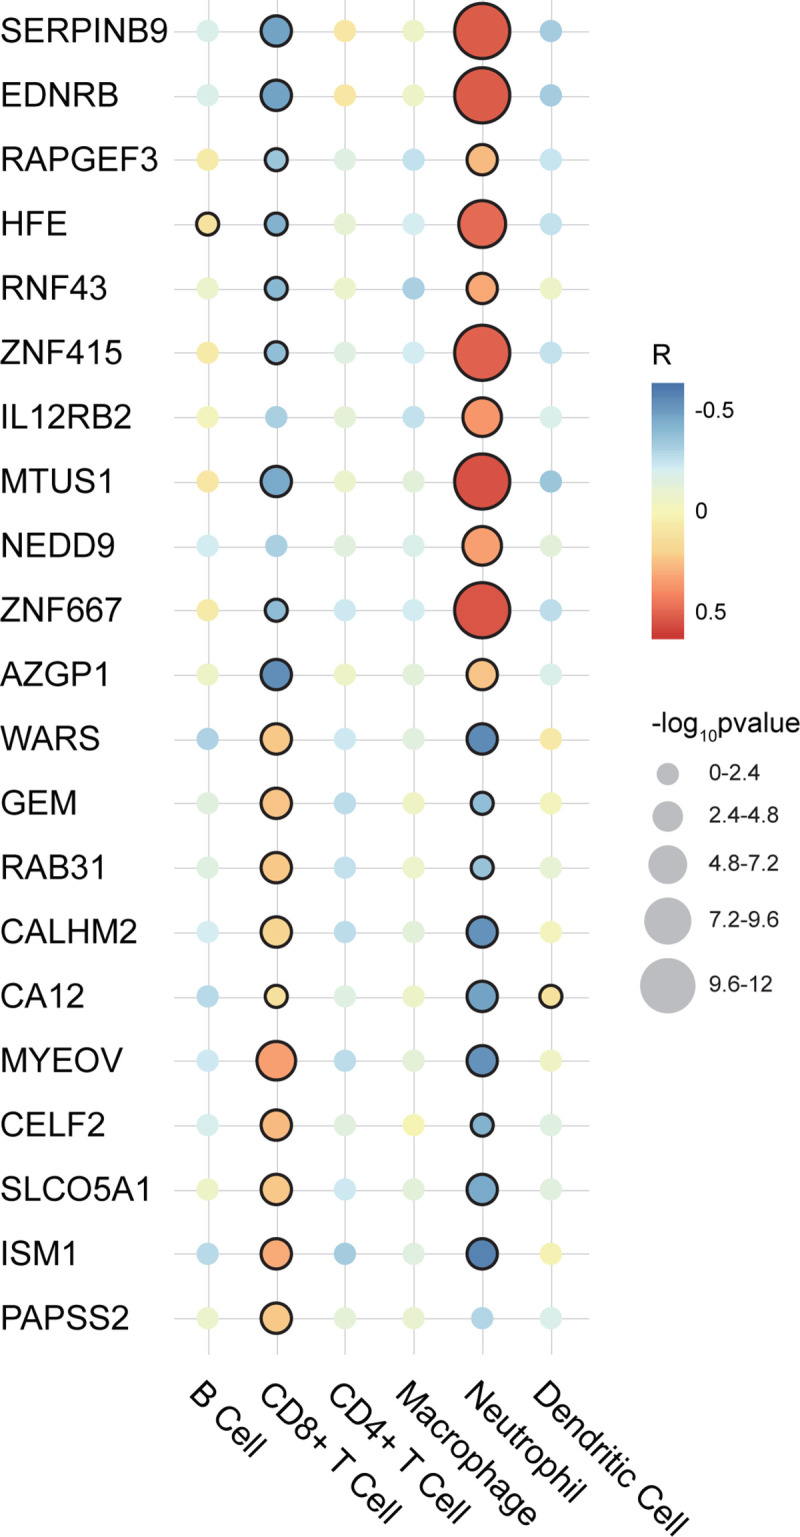
Fig 7. Correlation analysis between 21 prognostic genes and 6 TICs in UM.

The illustration is on the right. The larger the circle, the smaller the p-value and the more significant the correlation. A circle with a black edge represents statistical significance (p-value < 0.05). R: correlation coefficient; TICs: tumor-infiltrating immune cells; UM: uveal melanoma.
