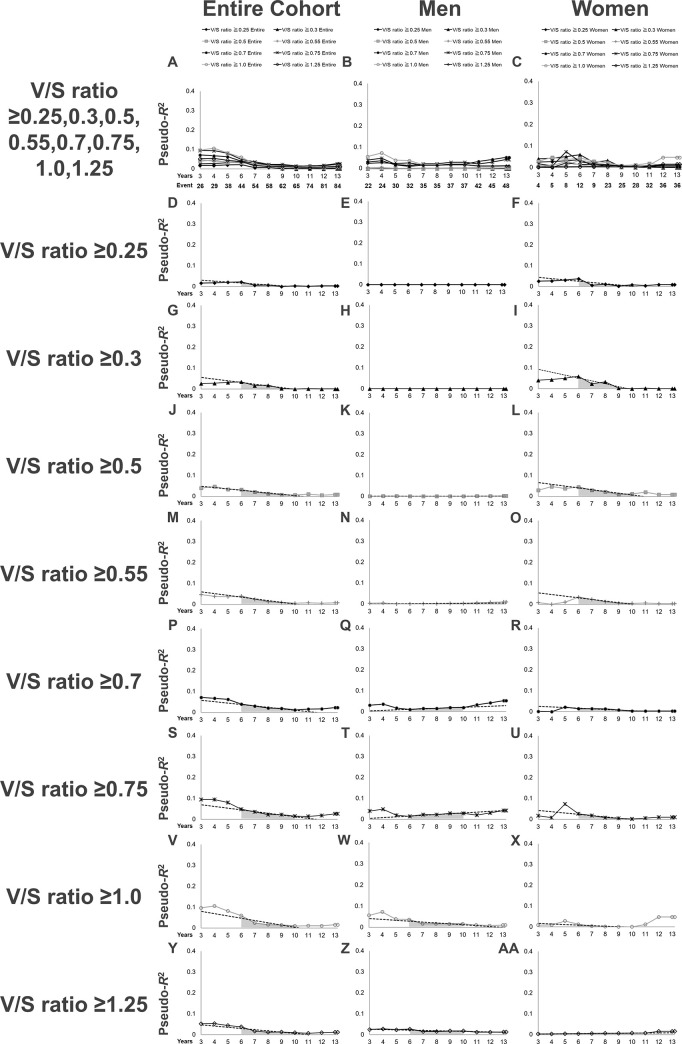
Fig 3. Time-series changes in the pseudo-R2 values for the renal outcome in terms of each definition of a V/S ratio in the entire cohort.
(A-C): Pseudo-R2 values for all definitions of a high V/S ratio for the entire cohort and each sex are presented superimposed. The lines represent the time-series changes in the pseudo-R2 values for the renal outcome in terms of each definition of a high V/S ratio in the entire cohort (A), men (B), and women (C). (D–F): Pseudo-R2 values in terms of a V/S ratio ≥0.25. (G–I): Pseudo-R2 values in terms of a V/S ratio ≥0.3. (J–L): Pseudo-R2 values in terms of a V/S ratio ≥0.5. (M–O): Pseudo-R2 values in terms of a V/S ratio ≥0.55. (P–R): Pseudo-R2 values in terms of a V/S ratio ≥0.7. (S–U): Pseudo-R2 values in terms of a V/S ratio ≥0.75. (V–X): Pseudo-R2 values in terms of a V/S ratio ≥1.0. (Y–AA): Pseudo-R2 values in terms of a V/S ratio ≥1.25. Dotted lines mark the least-squares regression line from the 6th year to the 10th year. The gray area under the lines represents the 6Y–10Y Mean. Abbreviations: V/S ratio, visceral to subcutaneous fat ratio; 6Y–10Y Mean, the mean value of the pseudo-R2 values from the 6th year to the 10th year.

