Figure 2.
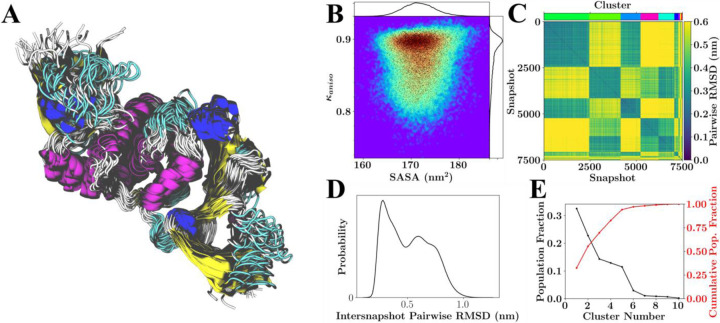
Configurational variability of PLPro with neutral HIS protonation states. (A) Overlay of 26 RMSD aligned structures from the lowest temperature replicate spanning the 750 ns of sampling. (B) Population distribution for shape anisotropy (κ) and solvent accessible surface area (SASA), with redder colors indicating greater occupancy of these kappa-SASA combinations. The distributions are also reflected by one-dimensional histograms above and to the right of the plot, and black dots within the population distribution, which represent position information for 10% of the total snapshots considered. (C) Pairwise RMSD clustering for the lowest temperature replica, with the snapshots ordered according to their cluster. The clusters in this instance were defined using a cutoff of half the maximum RMSD observed within the simulation and are labeled according to color with a color-bar for reference located above the plot. (D) Pairwise RMSD distribution across all snapshots. (E) Population statistics for the clusters introduced in (C).

