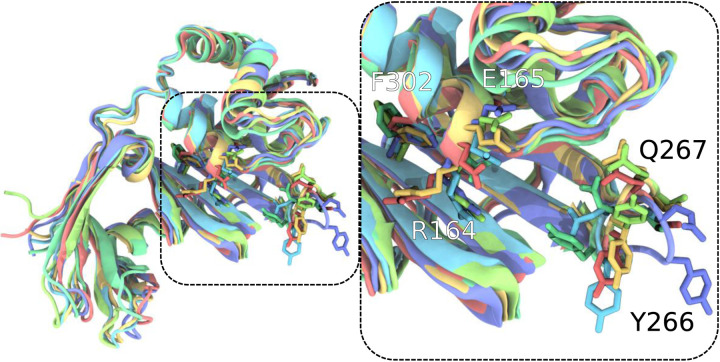
Figure 3.
Configurational variability of the PLPro active site region generally bounded by the black dashed lines and the next step in analysis after Figure 3. Each of the differently colored aligned protein models represents the center of a populous cluster, as defined by active site conformation RMSD. Residues such as R164, E165, Y266, Q267, and F302 vary in conformation substantially and highlight the conformational variation within the ensemble created through T-REMD. For clearer visualization, only residues 91 and onward for PLPro are shown, as this selection was used for active site alignment. Within the VMD130 rendering, sidechains are displayed without their hydrogens.

