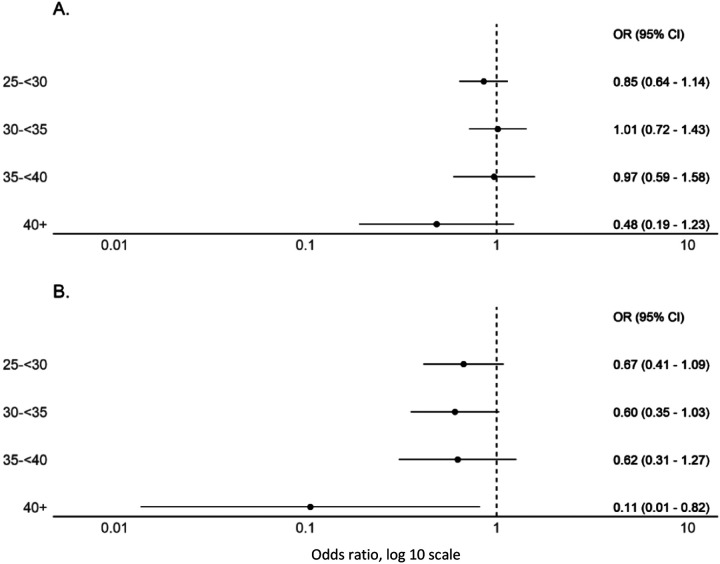
Figure 1. Forest plots of adjusted odds ratio for seropositivity by BMI as a categorical variable with normal BMI (18·5-<25) as reference.
(A) Includes participants with BMI measures and demonstrates a non-significant trend to declining seroprevalence with BMI ≥40 kg/m2 when compared to normal/healthy weight (BMI 18·5–24 kg/m2) (n=4270). (B) Includes only participants from a single high seroprevalence (22·5%) location in South Texas where the high force of infection may more clearly delineate infection risks (n=629).

