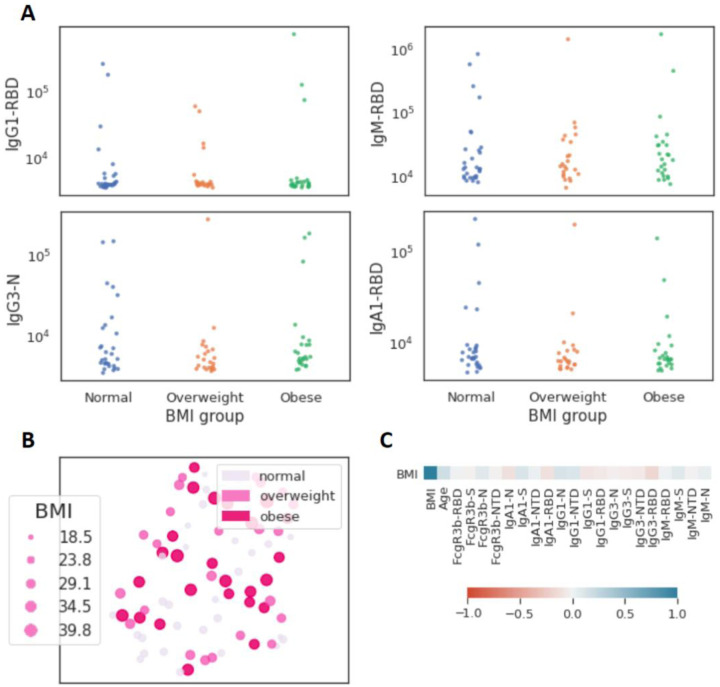
Figure 4. Limited influence of BMI on SARS-CoV-2 antibody profiles (n=77).
(A) The dot plots show similar mean fluorescent intensity levels of IgG1, IgM, IgG3, and IgA levels across individuals classified as normal weight (n=29), overweight (n=23), and obese (n=25). (B) The uniform manifold approximation and projection (UMAP) shows the relationship between antibody profiles and BMI (dot size, color intensity), highlighting the limited influence of BMI on shaping SARS-CoV-2 antibody responses. (C) Correlation plot of shows limited correlation between BMI and 20 immunological features.

