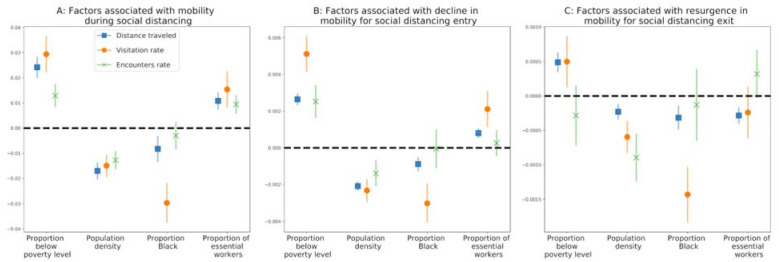
Figure 2: Socio-economic factors associated with social distancing.
We show the regression coefficients for four socio-economic predictors (A) mobility during social distancing (phase iii); (B) decline in mobility during entry to social distancing (phase ii); and (C) resurgence in mobility during exit from social distancing (phase iv). Results are shown for three measures of mobility: distance traveled, visitation rate, and encounters rate. The marker denotes the mean coefficient, and error bars show the 95% confidence interval. A positive association (above the dashed line) indicates that an increase in a given factor leads to a weaker implementation of social distancing. A negative association (below the dashed line) indicates that an increase in the given factor is associated with a stronger implementation of social distancing.

