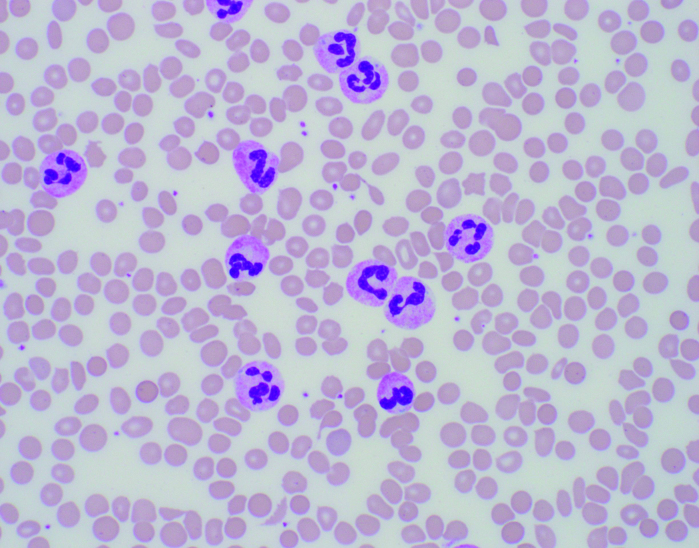
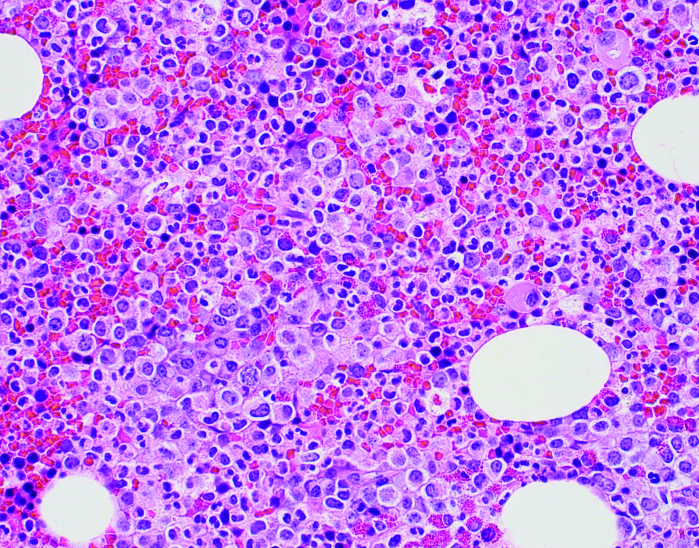
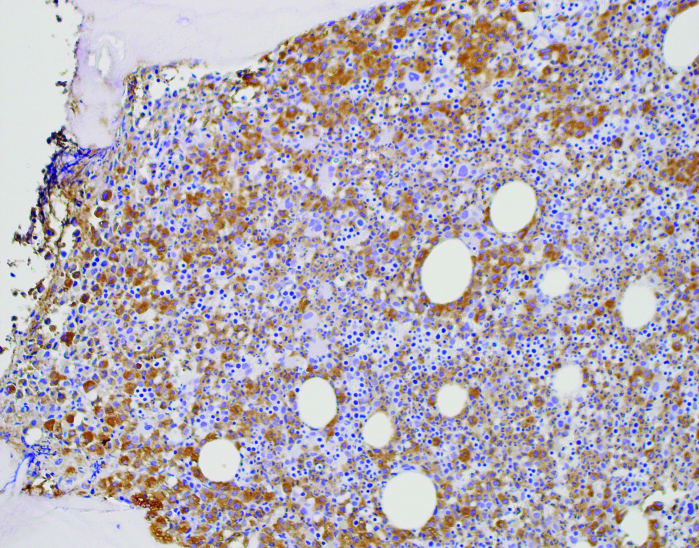
Figure 1.
(A) Peripheral blood smear. Note the predominance of mature neutrophils, the overall morphology, lobation, and how cytoplasmic granules appear “normal.” (B) Bone marrow biopsy at 200x, H & E. Demonstrates increased cellularity with mixed population of cells, increased myeloid precursors. (C) Bone marrow biopsy at 100x with myeloperoxidase staining. Same biopsy in (B) after staining confirms most cells are myeloid (brown); remaining population consists of erythroid cells and a few megakaryocytes.


