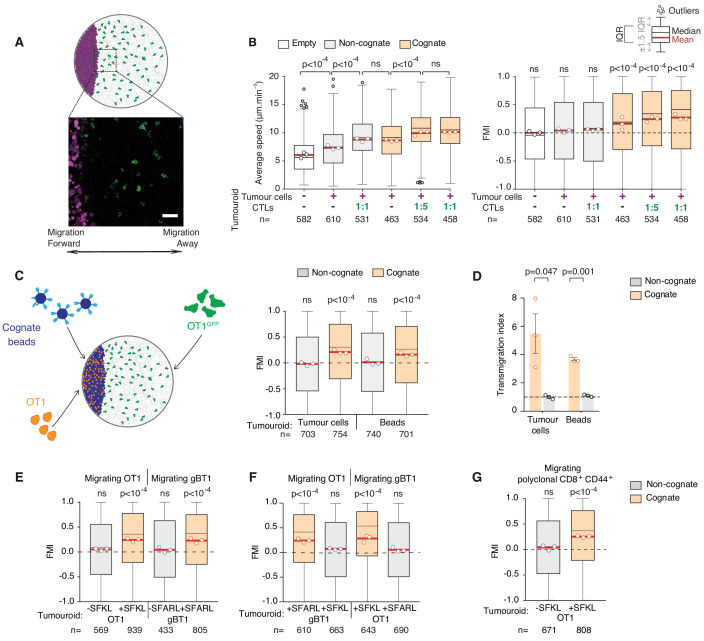
Figure 2. CTLs migrate rapidly and directionally towards sites of cognate target engagement due to a diffusing homotypic signal.
(A) Schematic of assay enabling 3D tracking of CTL movements relative to a tumouroid exposing a straight interface (scale bar: 50 µm). (B) Average speed and forward migration index (FMI) of CTLs adjacent to tumouroids containing cognate (SIINFEKL-pulsed) EL4 tumour cells or non-cognate (unpulsed) EL4, and without (-) or with pre-embedded tumour-reactive CTLs at indicated CTL:tumour cell ratios. (C) Left: Schematic showing H-2Kb/SIINFEKL cognate antigen-coated beads co-embedded with CTLs (OT1) in a dense mass, with the migration of adjacent fluorescent CTLs (OT1GFP) tracked in 3D over time. Right: FMI of CTLs migrating towards tumouroids containing OT1 CTLs and non-cognate or cognate tumour cells or beads. (D) Transmigration of CTLs towards supernatant obtained from CTLs conjugated with non-cognate or cognate cells and beads. Bars: mean from three independent experiments (data points). Error bars: SEM. p-values for comparisons of cognate and non-cognate conditions by t tests. (E) FMI of OT1 or gBT1 CTLs migrating towards tumouroids pre-embedded at a 1:1 ratio with OT1 or gBT1 CTLs respectively, showing ‘self-recruitment’ of CTLs. (F) FMI of OT1 or gBT1 CTLs migrating towards cognate tumoroids (EL4 pulsed with SIINFEKL or SSIEFARL as indicated) pre-embedded at a 1:1 ratio with gBT1 or OT1 CTLs, showing ‘cross-recruitment’ of CTLs of different antigen specificity towards tumour-reactive CTLs. Tumouroid densities are kept constant, and when pre-embedded with CTLs contain only half the number of tumour cells compared to masses in 2B constituted exclusively of tumour cells. (G) FMI of polyclonal CD8+CD44+ T cells migrating towards tumouroids containing OT1 CTLs with cognate or non-cognate tumour cells. Box-whiskers indicate medians and the interquartile range (IQR) with outliers outside whiskers. Red bars: mean of pooled data from three independent experiments. Data points: mean of each individual experiment. n: number of tracks. ns: p>0.05, where FMI in (B) to (G) were compared to a theoretical median of 0 using the two-tailed Wilcoxon signed rank test and average speeds in (B) were compared using the Kruskal-Wallis test followed by Dunn’s multiple comparisons tests.


