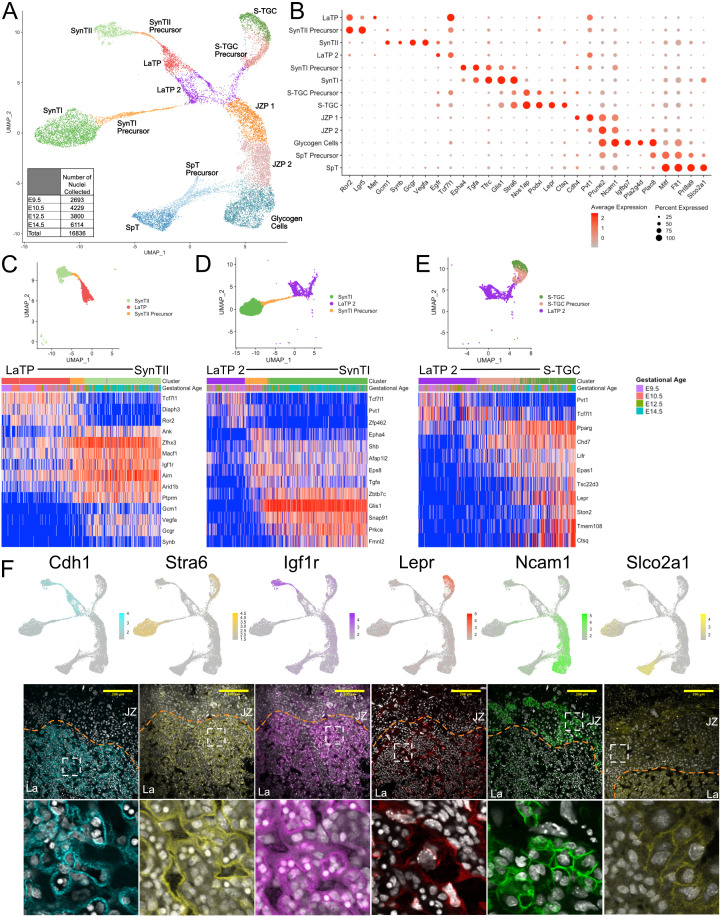
Figure 2. Sub-clustering of the trophoblast nuclei identifies the cell types of the labyrinth and junctional zone.
(A) UMAP showing the 16,836 nuclei included in the trophoblast subset, clustered and plotted according to transcriptome similarity. Clusters were annotated according to canonical marker genes and named below. Inset shows the number of nuclei collected at each gestational age. (B) Dot plot showing average expression and percent of nuclei in each cluster expressing canonical and novel marker genes identified for each cluster. Genes listed on the x-axis and clusters on the y-axis. (C–E) Nuclei along the differentiation from LaTP to SynTII, SynTI, and S-TGC were ordered by pseudotime using Slingshot. The nuclei included along each pseudotime axis shown at top. The expression of select genes (y-axis) representing each differentiation are shown in each heatmap. Each column represents a nucleus organized in pseudotime proceeding from left to right along the x-axis. (F) Expression of genes unique to several trophoblast populations projected in UMAP space (top) and localization of corresponding protein in E12.5 mouse placenta sections by immunofluorescence staining (Middle – 20x, Scale Bar = 200 µM; Bottom – high magnification inset area shown by white dashed line). Separation of labyrinth (La) and junctional zone (JZ) shown by the orange dashed line.


