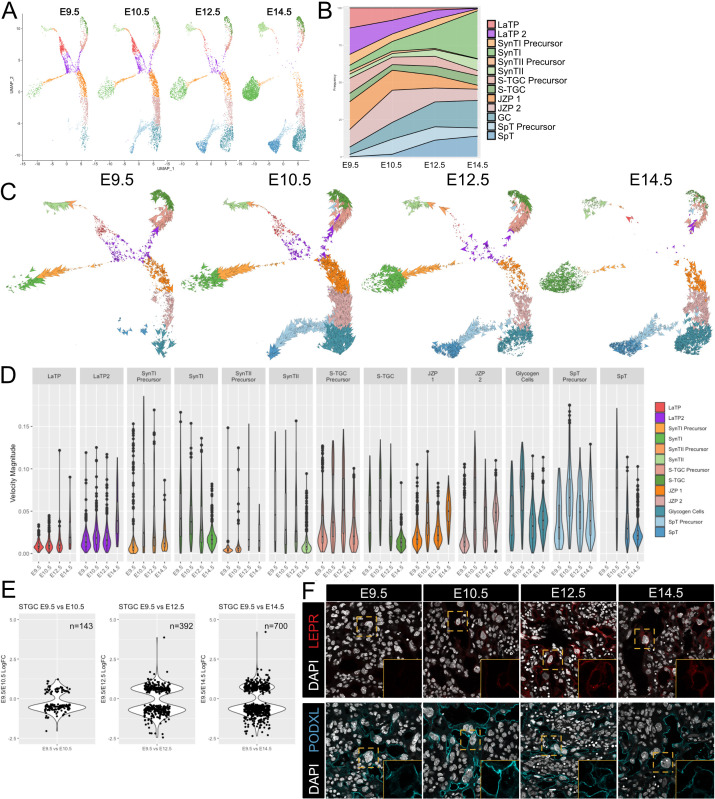
Figure 3. Developmental time course and trajectory inference reveal details of lineage dynamics and commitment in trophoblast.
(A) UMAP projection of all nuclei captured at each gestational age. (B) Quantification of the proportion of each cluster captured at each developmental time point. (C) RNA velocity vectors of the trophoblast nuclei at each time point. Arrows show the estimated magnitude and direction of each nucleus in pseudotime. (D) The magnitude of velocity vectors shown in D summarized as violin plots, with nuclei split by cluster identity and developmental time point. (E) Violin plots showing the log2 fold change of differentially expressed genes between nuclei from S-TGC at E9.5 vs. each other timepoint. (F) Immunofluorescence staining of LEPR (top) and PODXL (bottom) in the placental labyrinth at each developmental timepoint at 63x. Insets, magnification of area surrounding a S-TGC indicated by dotted line, DAPI stain removed to highlight protein expression.


