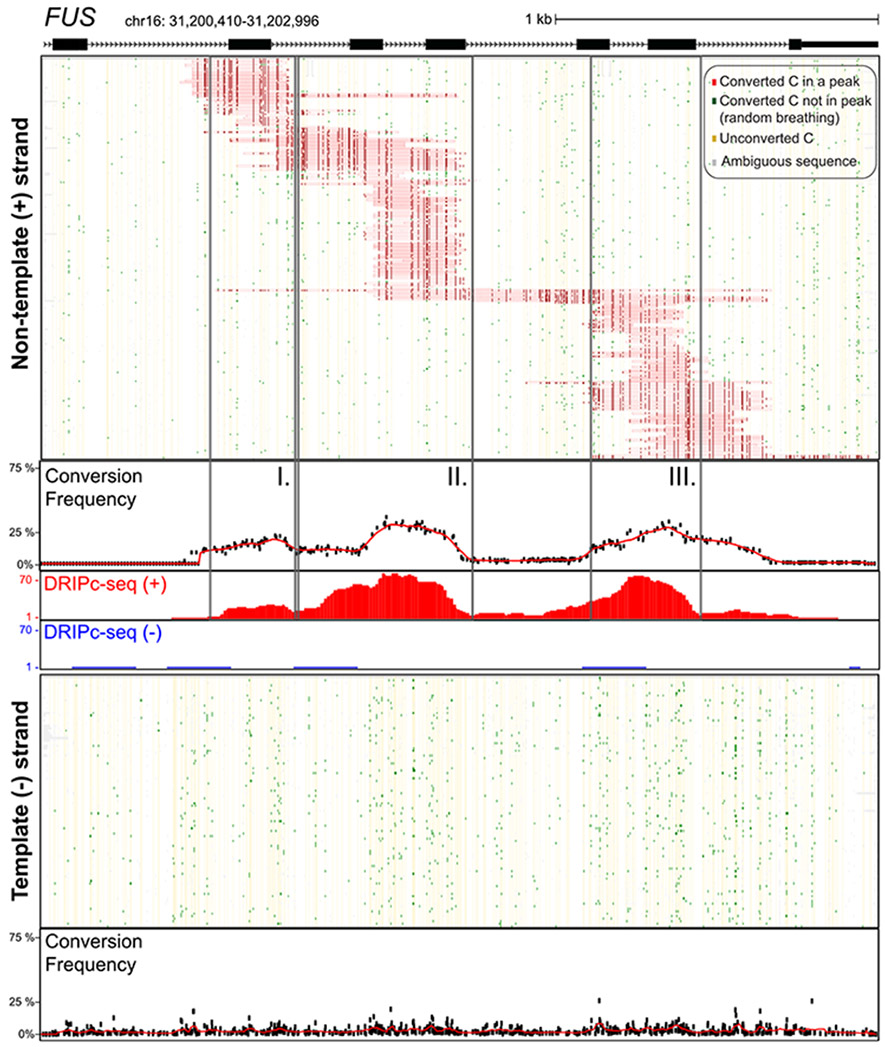
Fig. 1. Single-molecule R-loop footprints at the human FUS locus.

The structure of FUS over the amplicon is shown at top with exons as boxes; coordinates for the amplicon (hg19) along with a scale bar are also displayed. Two hundred twenty-six independent molecules carrying R-loop footprints on the nontemplate strand are shown at top. Each horizontal line corresponds to one DNA molecule. The status of each cytosine along the sequence is color-coded with footprints highlighted in red (see inset for color codes). These footprints were obtained using SMRF-seq with native PCR primers independently of any S9.6 enrichment. The aggregate C to T conversion frequency calculated over R-loop–containing molecules is shown along with the bulk S9.6-based R-loop signals obtained independently from DRIPc-seq (red indicates signal on the (+) strand; blue on the (−) strand). Vertical boxes highlight three regions where R-loop footprints pileup. One hundred independent molecules recovered from the template strand were randomly sampled from the 14,489 sequenced and are displayed below along with the aggregate C to T conversion frequency for that strand.
