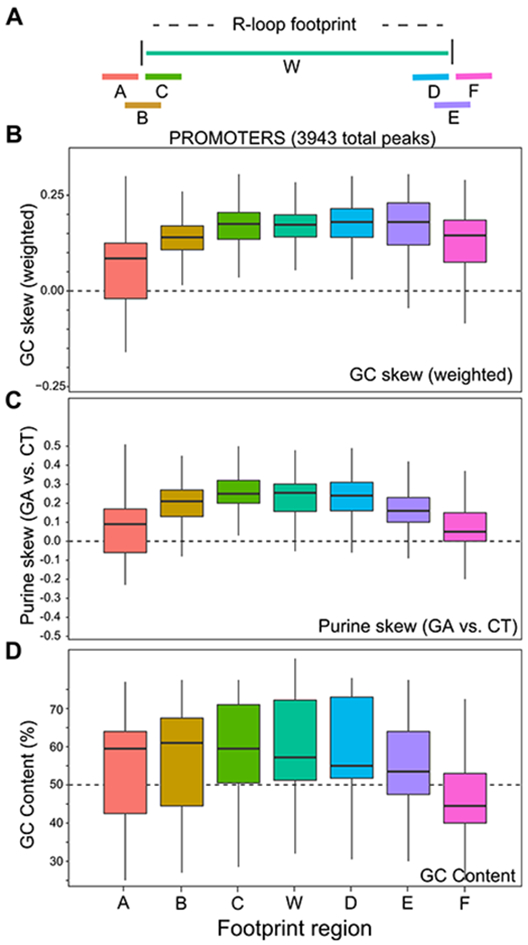
Fig. 6. Analyzing sequence transitions at R-loop edges.

(A) Schematic of the windows used for DNA sequence analysis; each window was 100 bp long. (B-D) Box plots depicting variation in GC skew, purine skew and GC content for a broad range of promoter R-loop footprints across windows spanning R-loop proximal and distal ends.
