
Figure 6.
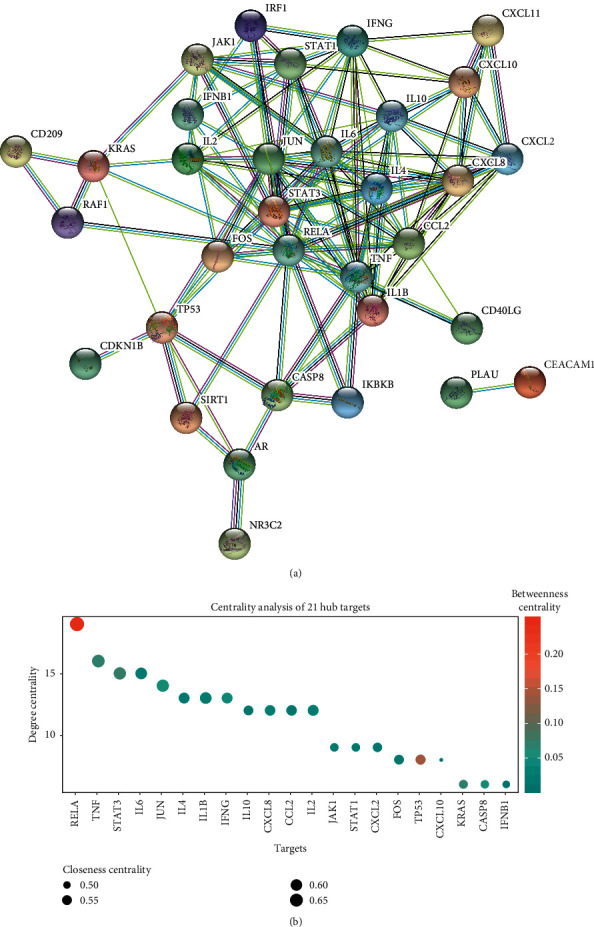
The PPI network for SZS and hub target analysis. (a) Network nodes indicate proteins, and edges represent protein-protein associations. (b) The centrality of targets was evaluated according to the degree centrality, betweenness centrality, and closeness centrality.