
Figure 2.
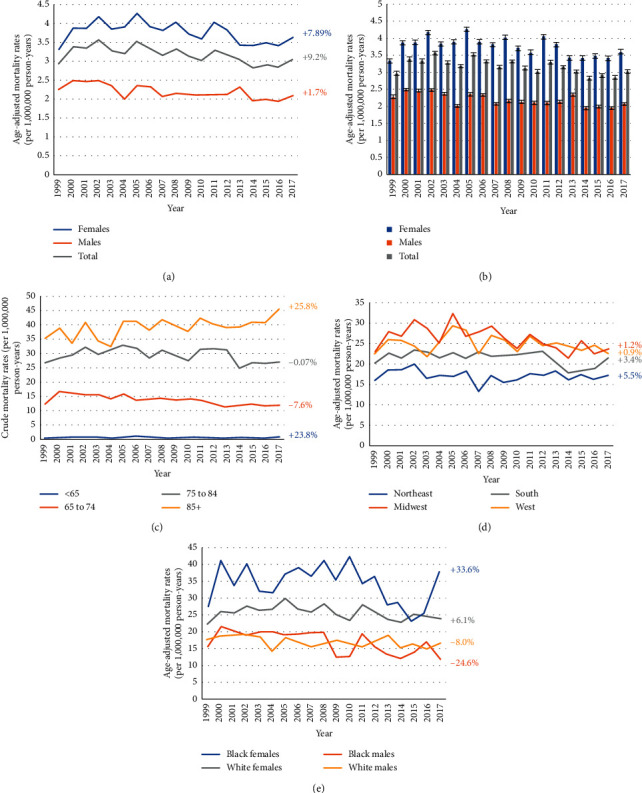
1999–2017 US age-adjusted mortality rates due to rheumatoid arthritis and diabetes for gender groups (a, b) and age groups (c). Age-adjusted mortality rates due to osteoporosis and diabetes among patients 65 years or older for census region groups (d) and both race and sex groups (e).