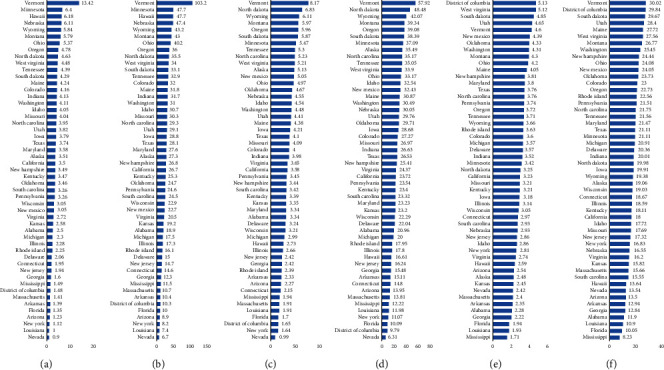
Figure 4.

Age-adjusted mortality rates due to osteoporosis and diabetes among the general population (a) and 65 years or older population (b) for different states. Age-adjusted mortality rates due to rheumatoid arthritis and diabetes for the general population (c) and 65 years or older population (d) for different states. Age-adjusted mortality rates due to osteomyelitis and diabetes for the general population (e) and 65 years or older population (f) for different states.
