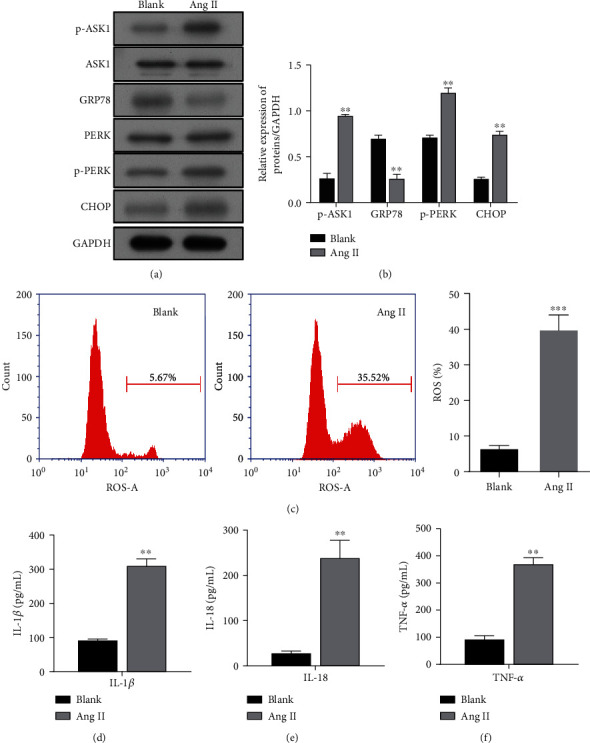
Figure 2.

Expression of p-ASK1, ER stress-related proteins, and proinflammatory cytokines in activated HSC cells. LX-2 cells were treated with Ang II. (a) The protein bands of p-ASK1, ASK1, GRP78, PERK, p-PERK, and CHOP as well as (b) the corresponding protein levels are shown. (c) The ROS levels measured using flow cytometry are shown in the left panel, and quantified results for ROS generation are depicted in the right panel. ELISA methods were used to determine the expression levels of proinflammatory cytokines, IL-1β (d), IL-18 (e), and TNF-α (f). Results are expressed as the mean value ± standard deviation (SD). ∗∗p < 0.01 and ∗∗∗p < 0.001, compared with the blank group.
