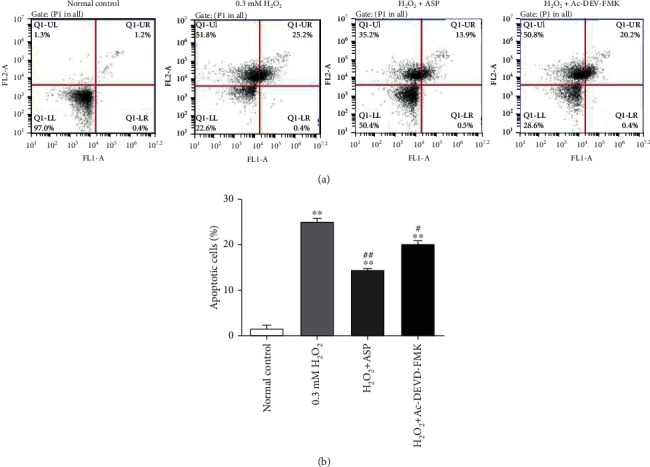
Figure 2.

Cell apoptosis in chondrocytes. (a) Chondrocytes were induced by various treatments. Chondrocytes cultured in DMEM for 0.5 h was used as a normal control. FITC Annexin V/PI staining and flow cytometry assays were used to detect cell apoptosis. (b) Results of cell apoptosis in different groups. Results are presented as means ± standard deviation of three independent experiments. ∗∗P < 0.01 versus normal control. #P < 0.05, ##P < 0.01 versus H2O2 group.
