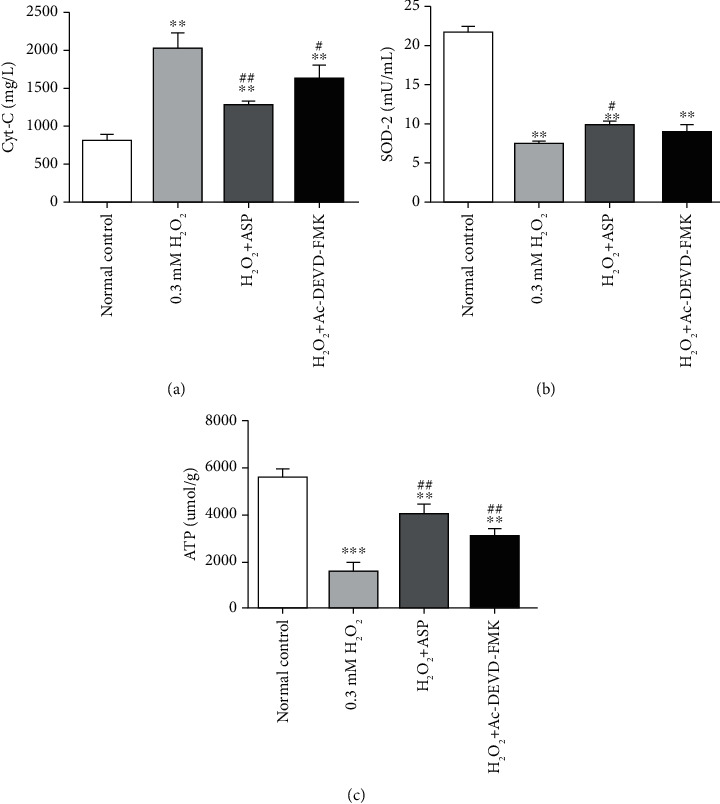
Figure 4.

Alter of mitochondrial function in chondrocytes induced by various treatments. Cultured and treated chondrocytes were harvested, and the levels of cytochrome C (a), SOD-2 (b), and ATP (c) in different groups were measured by assay kit. Results are presented as means ± standard deviation of three independent experiments. Untreated chondrocytes were used as normal control. ∗∗P < 0.01, ∗∗∗P < 0.001 versus normal control. #P < 0.05, ##P < 0.01 versus H2O2 group.
