
Figure 2.
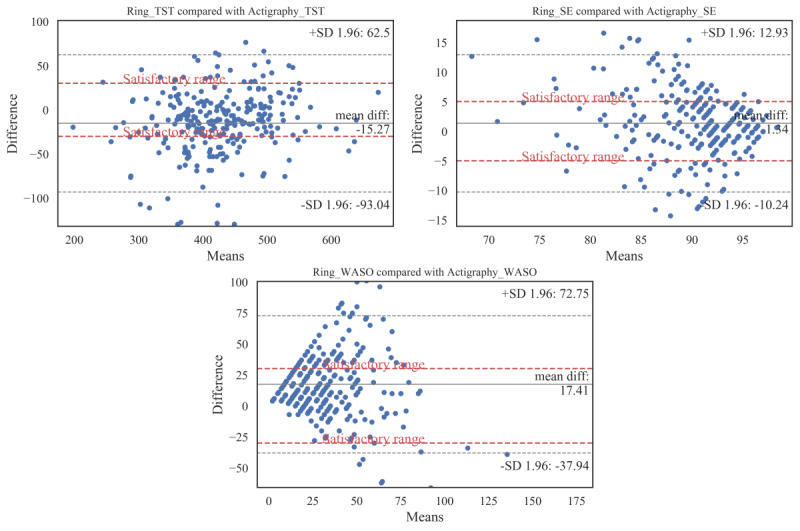
Bland-Altman plots for total sleep time, sleep efficiency, and wake after sleep onset gathered by the Oura ring and the actigraphy device. Subjects’ actigraphy minus Oura ring discrepancies on sleep parameters (y-axis) are plotted compared with actigraphy (x-axis). Biases, upper, and lower agreement limits are marked. In addition, the satisfactory ranges are plotted as the dashed lines. SE: sleep efficiency; TST: total sleep time; WASO: wake after sleep onset.