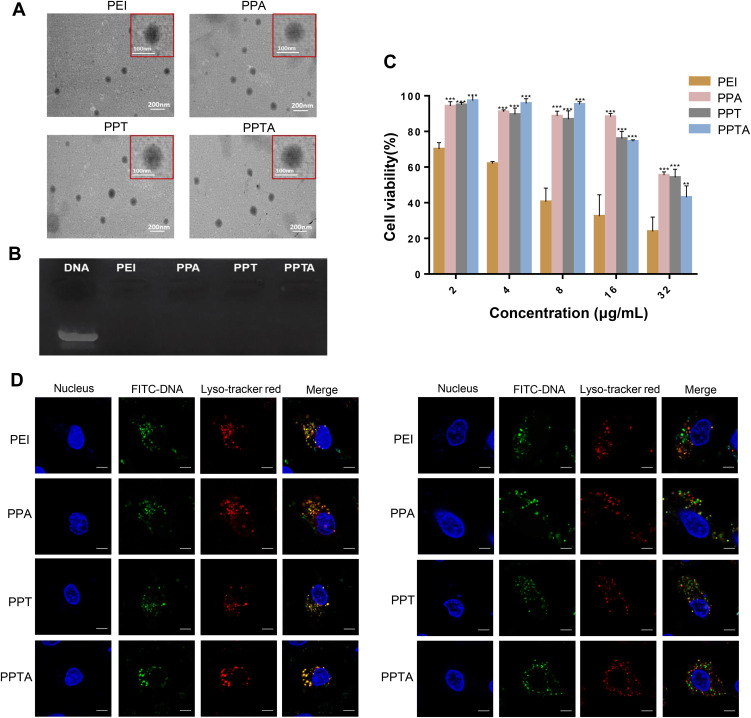
Figure 5.
Characterization and cytological evaluation of PPTA/pVAXI-En. (A and B) SEM images and agarose gel electrophoresis of PEI/pVAXI-En, PPA/pVAXI-En, PPT/pVAXI-En and PPTA/pVAXI-En. (C) Cytotoxicity of PEI, PPA, PPT and PPTA at various concentrations against HUVECs. ** and *** Indicate p<0.01 and p<0.001 versus the PEI group, respectively. (D) Fluorescence images of the intracellular distribution of PEI/FITC-pVAXI-En, PPA/FITC-pVAXI-En, PPT/FITC-pVAXI-En and PPTA/FITC-pVAXI-En in HUVECs at 2 h (left) and 4 h (right) after the beginning of transfection. Green, FITC-labeled pVAXI-En plasmid; blue, cell nuclei stained with Hoechst 33342; red, lysosomes stained with LysoTracker Red. Bars represent 10 μm.

