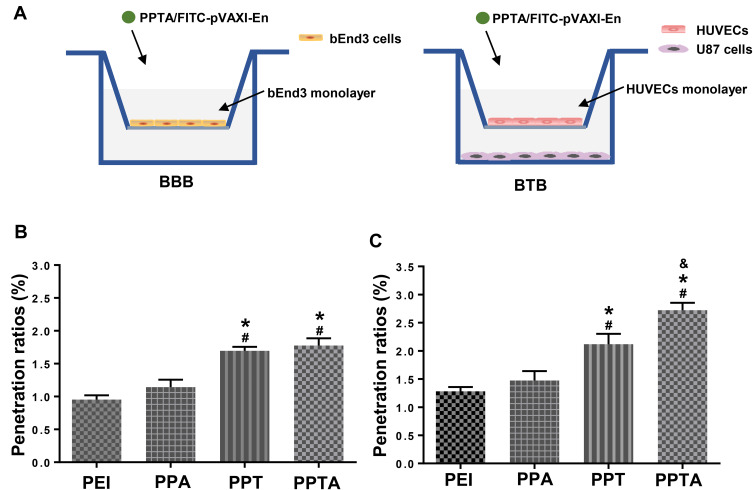
Figure 6.
Ability of PPTA/pVAXI-En to penetrate the BBB and BTB in vitro. (A) Schematic illustration of the in vitro BBB and BTB models. The penetration ratios of PEI/pVAXI-En, PPA/pVAXI-En, PPT/pVAXI-En and PPTA/pVAXI-En in the in vitro BBB model (B) and BTB model (C). * Indicates p<0.05 when compared with PEI/pVAXI-En, # indicates p<0.05 when compared with PPA/pVAXI-En, and & indicates p<0.05 when compared with PPT/pVAXI-En.

