Figure 8.
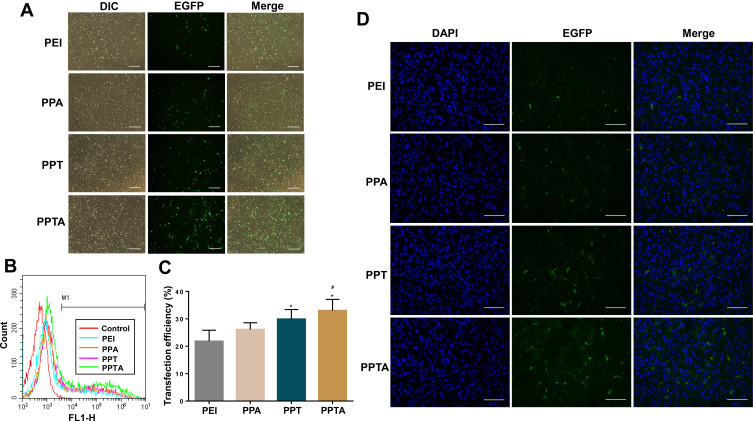
The gene transfection efficiency of PPTA in vitro and vivo. (A) Fluorescent images of HUVECs transfected with PEI/pEGFP-N1, PPA/pEGFP-N1, PPT/pEGFP-N1 or PPTA/pEGFP-N1. Bars represent 200 μm. (B) Flow cytometric histogram of the fluorescence intensity of HUVECs. (C) Quantitative evaluation of EGFP expression by flow cytometry in HUVECs. * Indicates p<0.05 when compared with the PEI group. # indicates p<0.05 when compared with the PPA group. (D) In vivo transfection efficiency. Fluorescence images of brain sections separated from intracranial U87 glioma-bearing nude mice transfected with PEI/pEGFP-N1, PPA/pEGFP-N1, PPT/pEGFP-N1 or PPTA/pEGFP-N1. Green, EGFP protein; blue, cell nuclei stained with DAPI. Bars represent 50 μm.

