Figure 9.
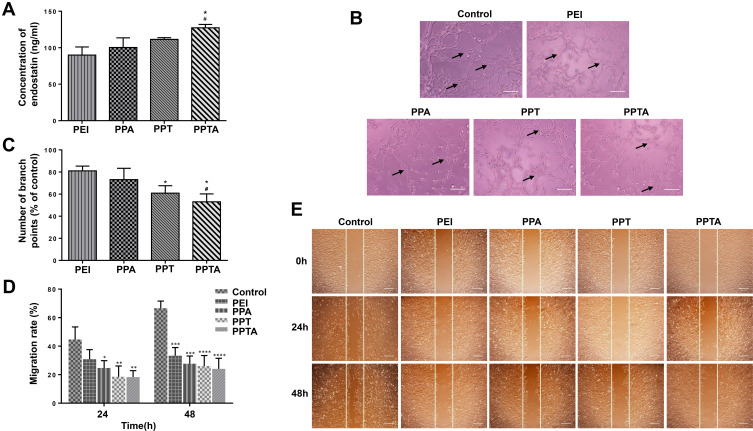
The inhibitory effect of PPTA/pVAXI-En on angiogenesis and the migration of HUVECs in vitro. (A) Expression level of the endostatin protein in the supernatant of HUVECs transfected with different nanocomplexes. * indicates p<0.05 when compared with PEI/pVAXI-En. # indicates p<0.05 when compared with PPA/pVAXI-En. (B and C) Photographs of tube formation and the quantification of branch points upon treatment with different nanocomplexes. The arrows indicate representative new blood vessel branch points. * indicates p<0.05 when compared with PEI/pVAXI-En. # Indicates p<0.05 when compared with PPA/pVAXI-En. Bars represent 50 μm. (D and E) The statistical migration rates and photographs showing the migration of HUVECs treated with different nanocomplexes. *, **, *** and **** Represent p<0.05, p<0.01, p<0.001 and p<0.0001 versus the control group, respectively. Bars represent 200 μm.

