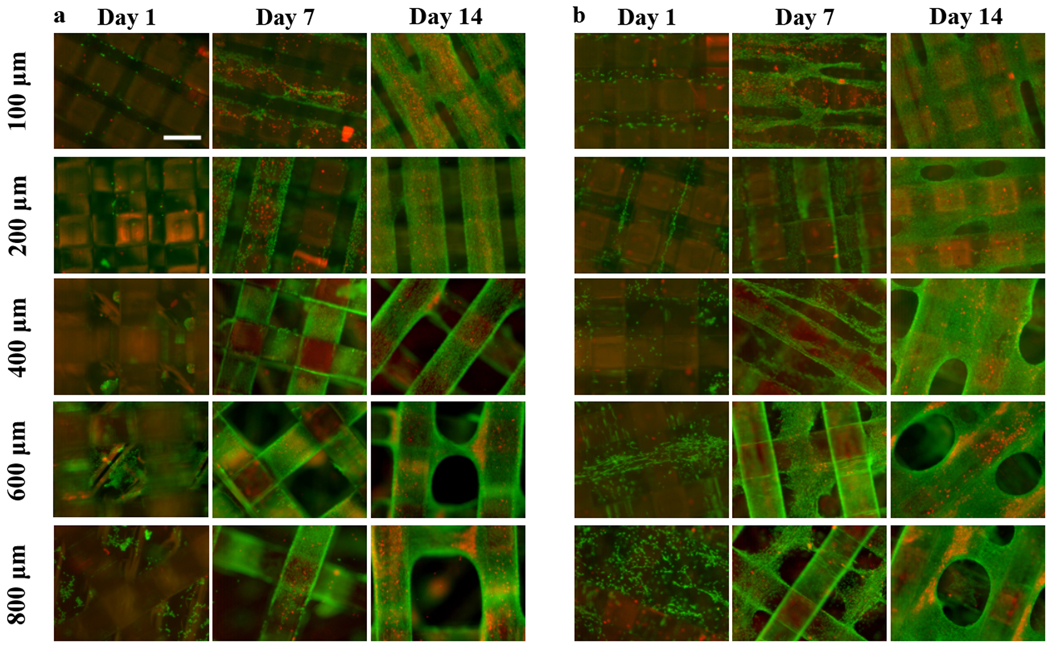
Figure 8.
Representative Live/Dead (Green = calcein AM in live cells, red = ethidium homodimer in dead cells)) staining images of NIH/3T3 cells, performed at days 1, 7 and 14 for a) bare and b) collagen filled porous structures, illustrating differences in cell distribution between groups. Scale bar = 400 μm.

